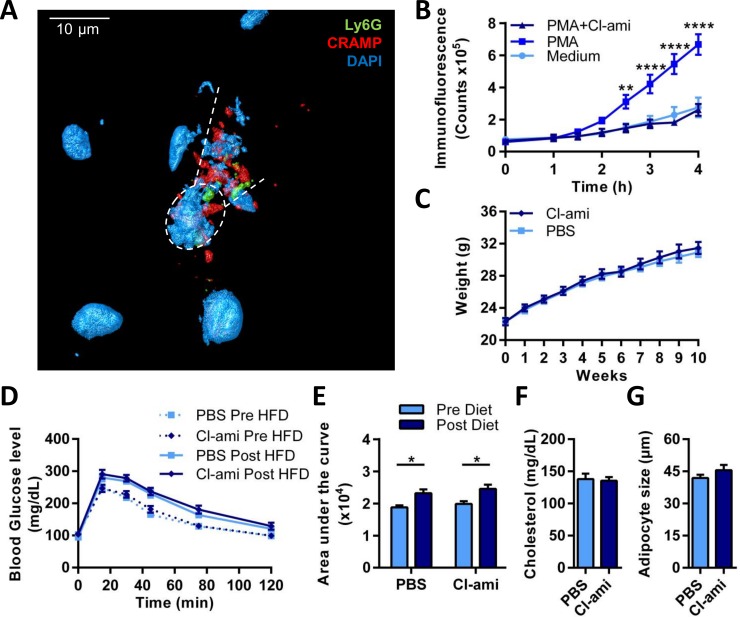
Fig 1. Cl-amidine treatment does not affect metabolic changes associated with high fat diet feeding.
A) 3D reconstruction of a NET in obese adipose tissue of HFD fed C57Bl6 mice imaged by immunofluorescence confocal microscopy. Co-localisation of the markers Ly6G (green), cathelicidin (red), and dapi (blue) is shown. Dotted circle shows a NET-releasing neutrophil between the dotted lines. B) Isolated neutrophils were incubated with medium, 100 nM PMA, or 100 nM PMA and 1 mM Cl-amidine (Cl-ami). NETosis was measured with the extracellular DNA dye Sytox green over a period of 4 hours (n = 7). C-G) Mice receiving a 60% HFD for ten weeks were treated with either Cl-amidine (n = 10; 10 mg/kg; s.c.; daily) or vehicle (PBS) (n = 10; s.c.; daily). C) The mice were weighted weekly. D) Prior (pre-HFD) and after 10 weeks of the HFD (Post-HFD) a glucose tolerance test was performed. The mice were fasted for 12 hours after which they received a subcutaneous injection of 1 mg glucose per g mice. Blood glucose levels were measured at different time points. E) Area under the curve was calculated from the GTT graphs Fig 1D. F) Plasma levels of cholesterol were measured by CHOD-PAP (Roche). G) Haematoxylin/eosin staining was performed on paraffin sections of EpAT and the diameter of 100 adipocytes per mice was calculated. Data is represented as mean ± SEM, *p = 0.05, **p = 0.01, ***p = 0.001, ****p = 0.0001, n = 10 for each group unless stated otherwise.

