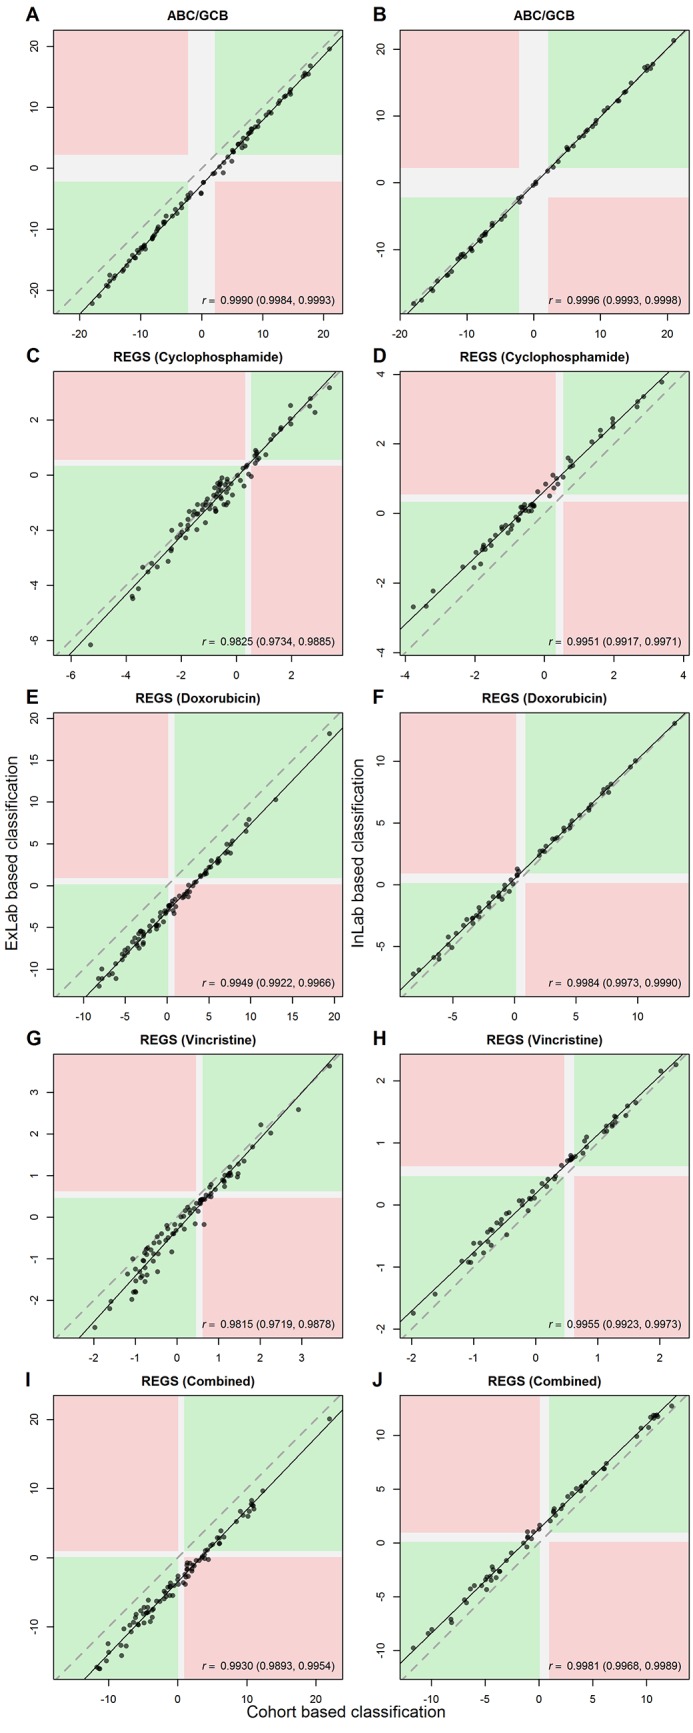
Fig 2. Comparison of logit probabilities for the ABC/GCB and REGS classifiers obtained through InLab or ExLab one-by-one normalization against cohort normalization.

The areas marked with green indicate patients with similar classification between cohort based normalization and ExLab one-by-one normalization (A, C, E, G, I), or InLab one-by-one normalization (B, D, F, H, J). The areas marked with red indicate complete misclassifications. For ABC/GCB and REGS the white areas indicate unclassified and intermediate sensitivity, respectively, in at least one of the classifiers. The dashed and solid line show the identity and total least squares line, respectively.
