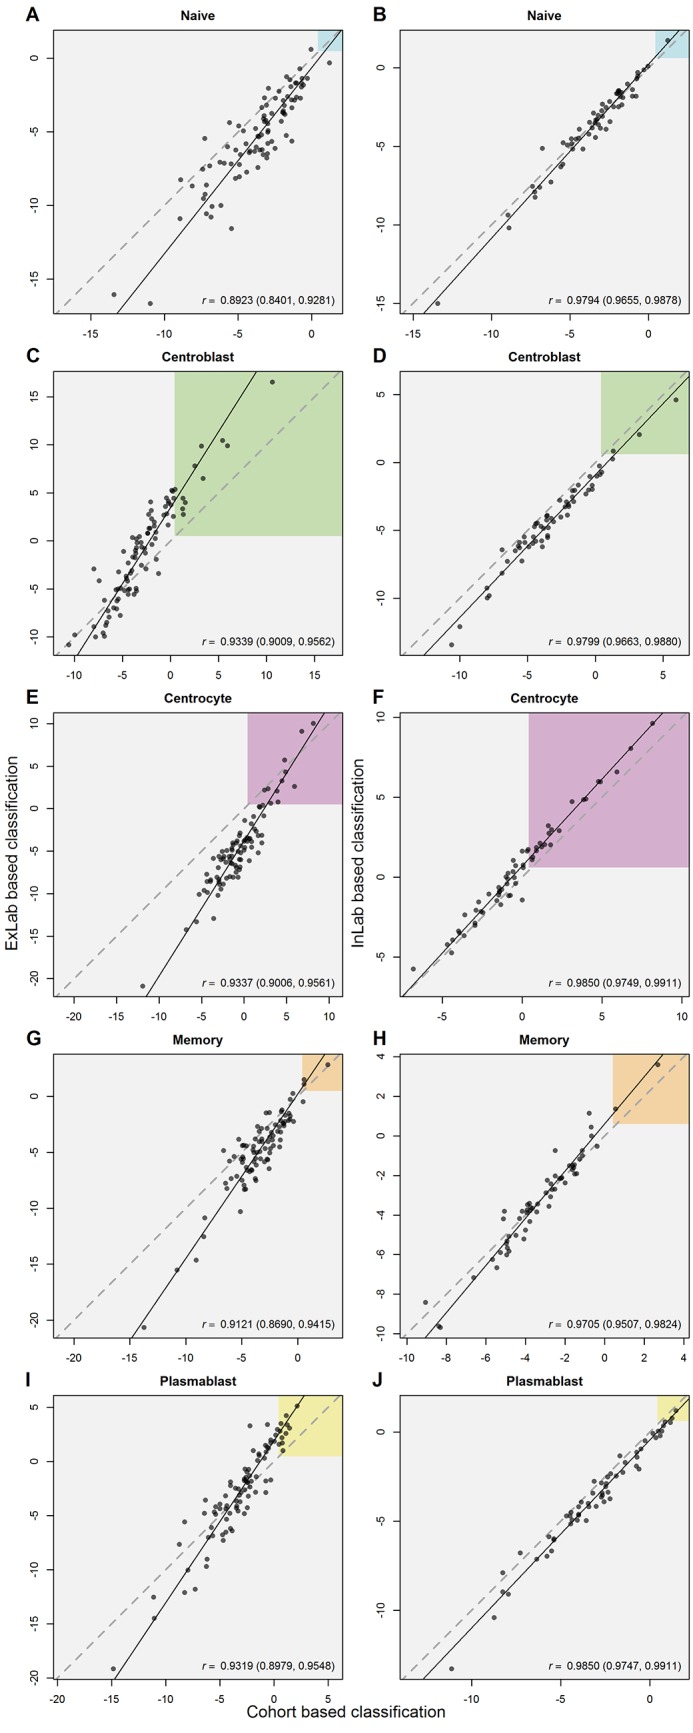
Fig 3. Comparison of logit probabilities for the BAGS classifier obtained through ExLab or InLab one-by-one normalization against cohort normalization.

The coloured regions in the figure correspond to a threshold probability of 0.5. The dashed and solid line show the identity and total least squares line, respectively.
