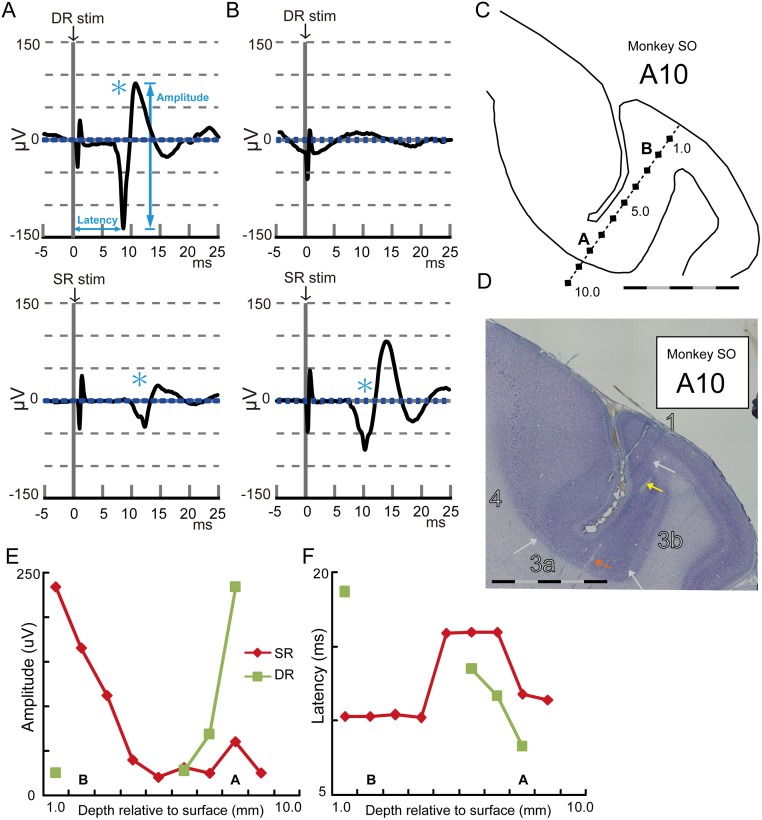
Fig 2. Representative examples of DR- and SR-evoked potentials.
(A) An example of the DR- and SR-evoked potentials recorded at the bottom of the posterior part of CS. Averaged traces of 60 trials are shown at the time aligned with DR and SR stimulations. An asterisk indicates a detected response compared with the baseline activity. Blue dotted lines indicate one standard deviation from the baseline activity. (B) Same as (A) except for recording at the superficial part of the posterior part of CS. (C) Reconstructed trace of the electrode insertion in which the SEPs in A and B were recorded. (D) An example of the thionine-stained coronal section in monkey SO. White arrows indicate the approximate locations of the borders of areas 4, 3a, 3b, and 1. Colored arrows indicate the lesion marks. The scale bars in C and D indicate 5 mm, separated by black and gray every 1 mm. (E) Amplitude plots of the DR- and SR-evoked potentials. The potentials were recorded every 1 mm from the surface to the bottom of the posterior part of CS as shown in C. (F) Latency plots of the DR- and SR-evoked potentials. In C, E, and F, characters A and B indicate the recording depth of the SEPs represented in A and B, respectively.

