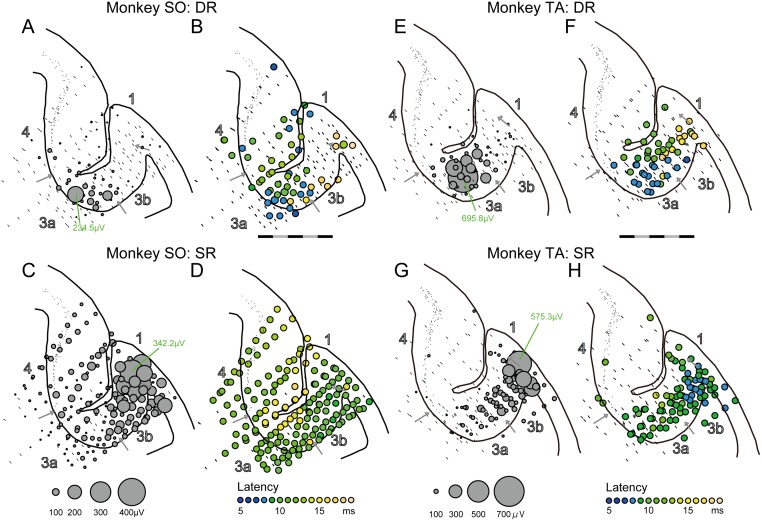
Fig 4. Overlaying plots of the DR- and SR-evoked potentials for all recording sites.
(A) Amplitude of the DR-evoked potentials for all recording sites in monkey SO. The circle size indicates the amplitude. A bar at each recording site indicates no significant response. (B) Latency plots of the DR-evoked potentials for all recording sites in monkey SO. The latency is indicated by colors. The scale bar indicates 5 mm, separated by black and gray every 1 mm. (C, D) Same as (A, B), but for the SR-evoked potentials. (E–H) Same as A–D, but for monkey TA. All SEPs from multiple anterior-posterior level were overplayed into one typical histology section in each monkey.

