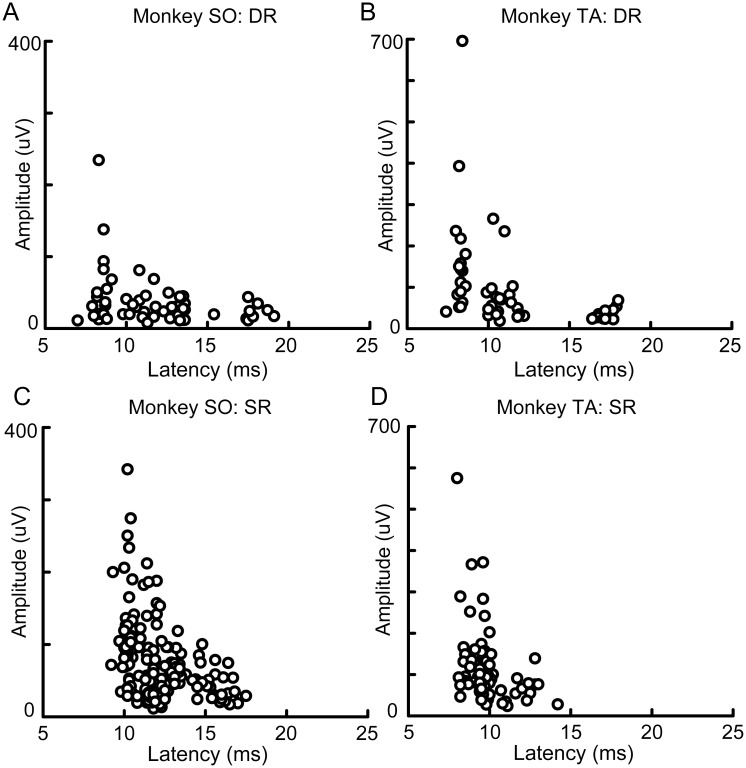
Fig 5. Relationship between response latency and amplitude of the DR- and SR-evoked potentials.
(A) Plots of the DR-evoked potentials against latency and amplitude. The 57 responses observed from 179 recording sites in monkey SO are shown. (B) Same as A, but for monkey TA. The 50 responses of 168 recording sites are shown. (C, D) Same as (A, B), but for the SR-evoked potentials. The 163 responses observed from 179 recording sites in monkey SO (C) and 87 responses observed from 168 recording sites in monkey TA (D) are shown.

