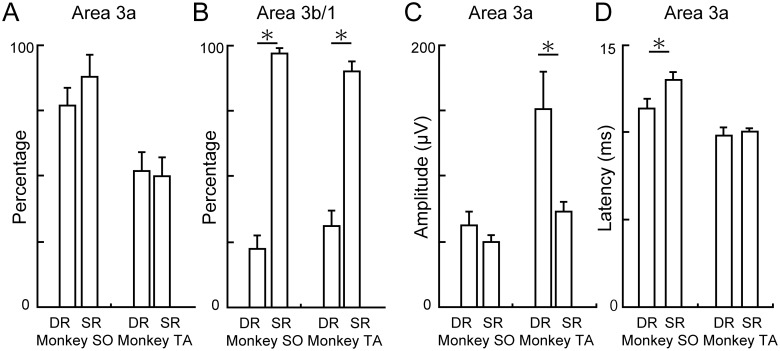
Fig 6. Characteristics of the SR-evoked potentials in area 3a.
(A) Percent responses evoked by DR and SR stimulations in area 3a. (B) Percent responses evoked by DR and SR stimulations in area 3b/1. (C) Amplitude of the DR- and SR-evoked potentials in area 3a. (D) Latency of the DR- and SR-evoked potentials in area 3a. Error bars in A–D indicated S.E. Asterisk in A–D indicates statistical significance at P < 0.05 using two-sample t-test.

