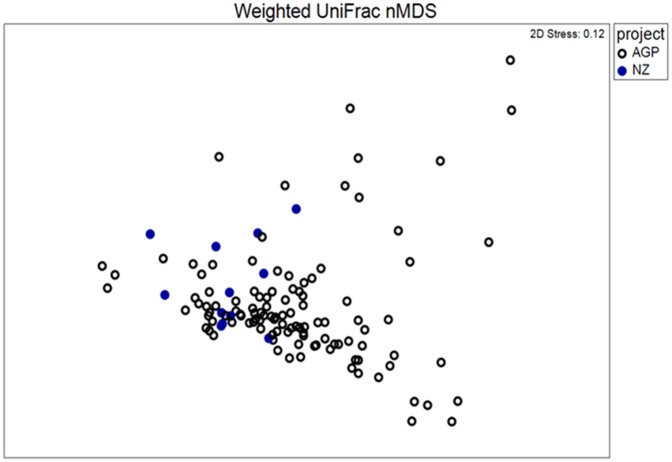
Fig 3. Non-metric multidimensional scaling plot showing overlap in bacterial community structure between the freeze-dried faecal samples from Cooper et al. [7] (blue symbols, n = 12) and a matched cohort of individuals from the American Gut Project (open symbols, n = 110).
The weighted UniFrac metric was applied.

