
Fig. 6.
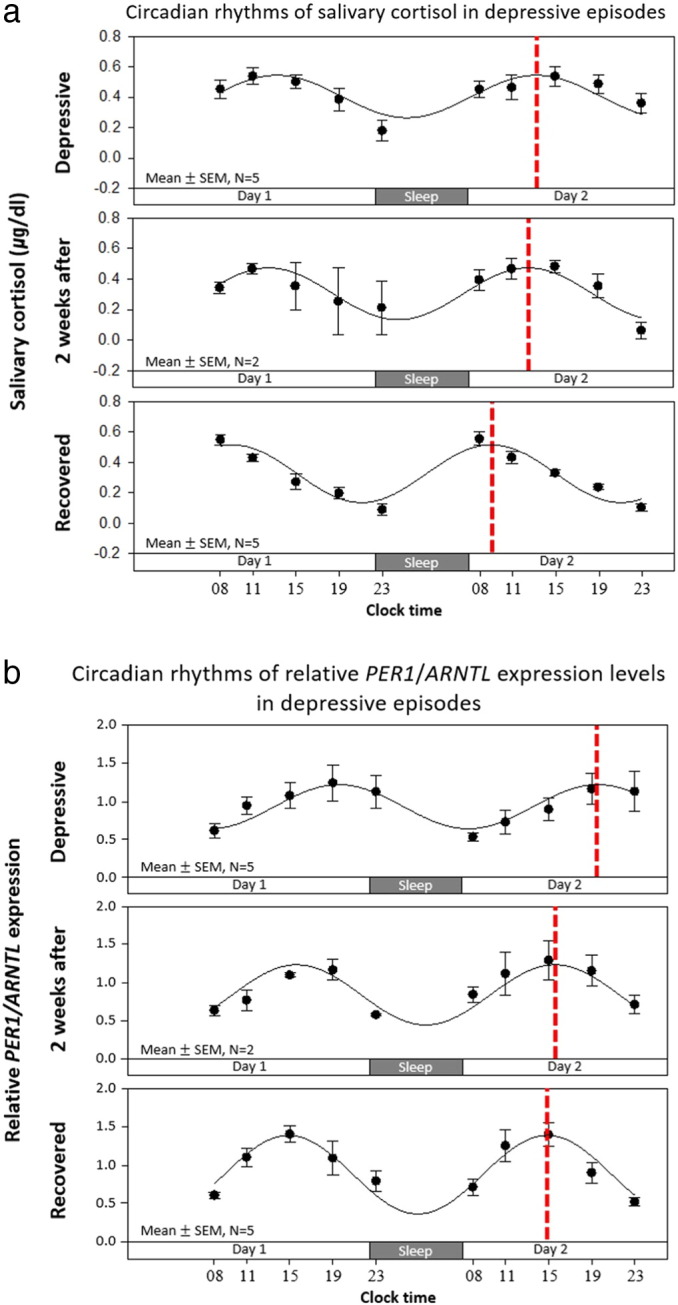
Mean biochemical circadian rhythms in depressive episodes (N = 5 episodes). (a) Circadian rhythms of salivary cortisol in depressive episodes. (b) Circadian rhythms of relative PER1/ARNTL expression levels in depressive episodes. Black dots indicate mean ± SEM, curved black lines indicate the fitted sine curves of mean values, and broken red lines indicate acrophases of each circadian rhythms.