
Figure 10. PCoA plots of healthy controls versus subjects with IBD.
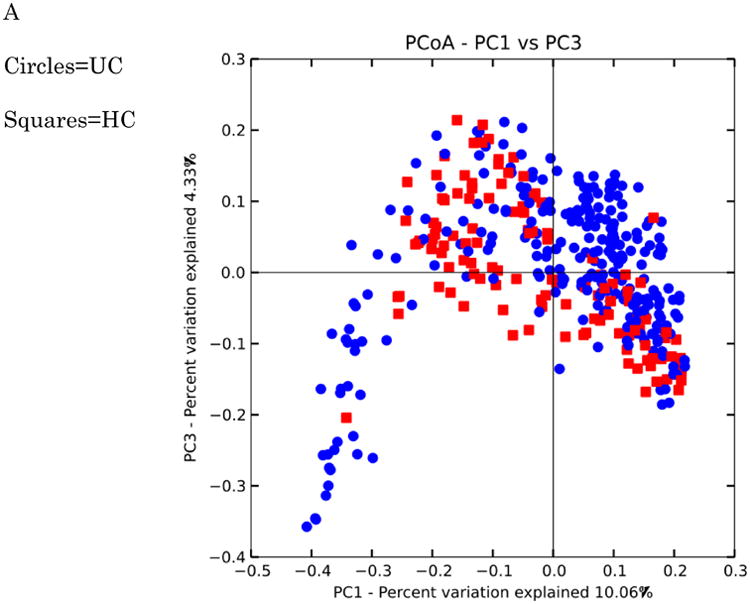
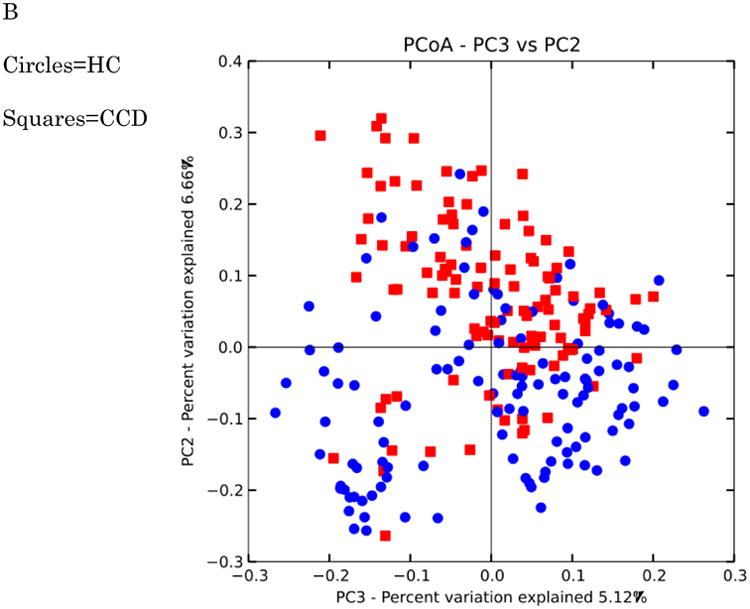
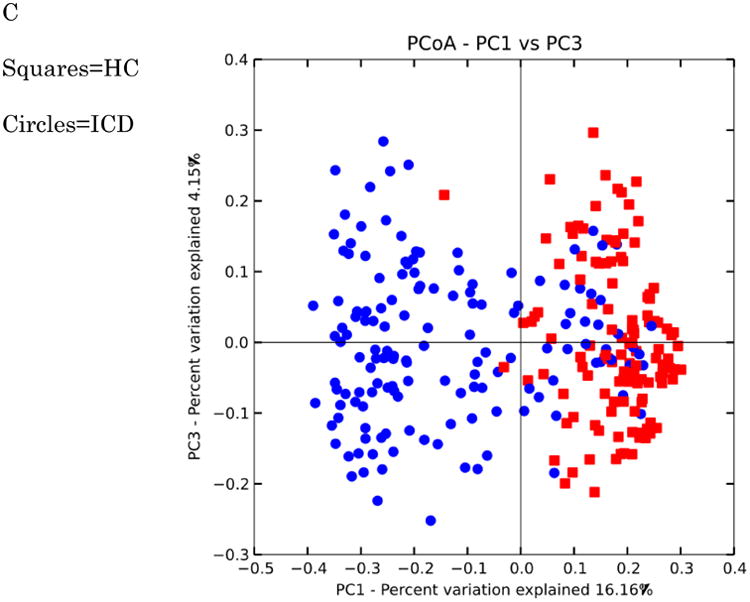
Distances were calculated with unweighted UniFrac. A-HC vs UC samples B. HC vs CCD samples C. HC vs ICD samples. Distances between healthy controls and all IBD categories are significantly different (p-value < 0.050 with PERMANOVA tests (999 permutations). Data were evenly sampled at 1004 sequences per sample.