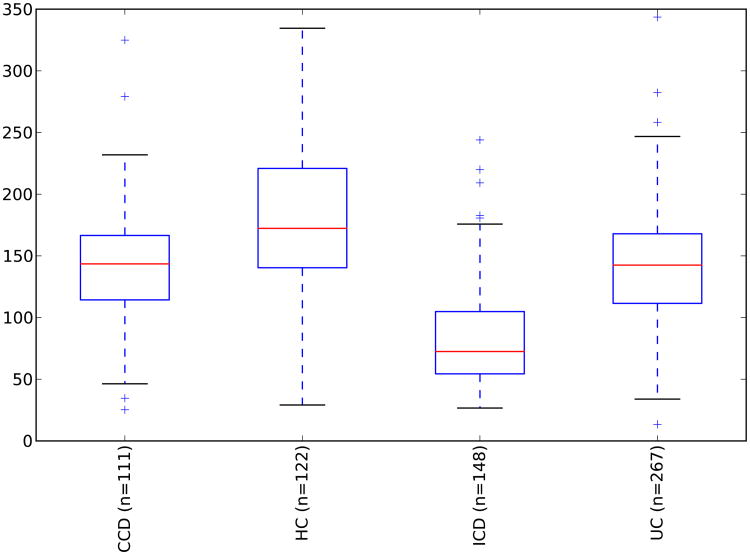
Figure 11. Alpha diversity for IBD subjects and healthy controls.
Y-axis indicates observed species value. Healthy control samples are significantly different from all inflammatory bowel disease categories with a p-value of < 0.05 (Monte Carlo permutation test, permutations = 999). The samples were repeatedly sampled (10×) at 1000 sequences/sample.

