
Figure 8. Receiver operator characteristic curve values for all Turnbaugh lean and obese subjects.
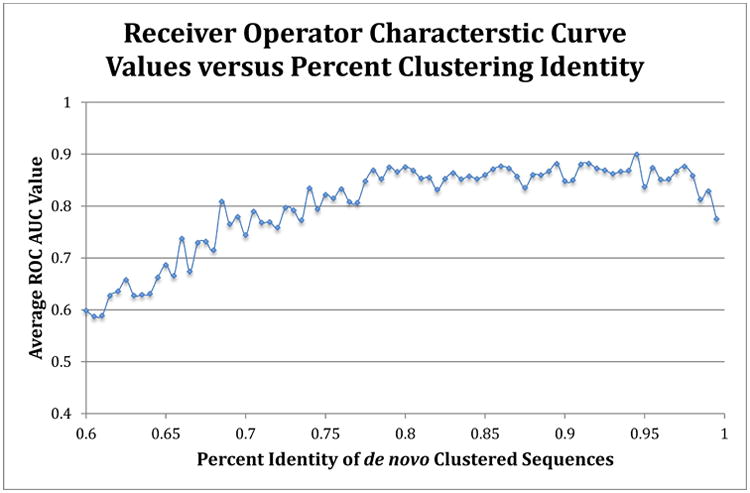
The average ROC area under the curve value (using random forest method) for each clustering identity was calculated by the averaging the 5× repeated (with 10-fold cross-validation) optimized ROC values. A 0.5 value indicates no better than random guess, while 1.0 indicates perfect sensitivity and specificity. The sequences were clustered using a de novo approach for each percent identity listed.