
Figure 9. Phylum-level taxa plots for IBD subjects versus healthy controls.
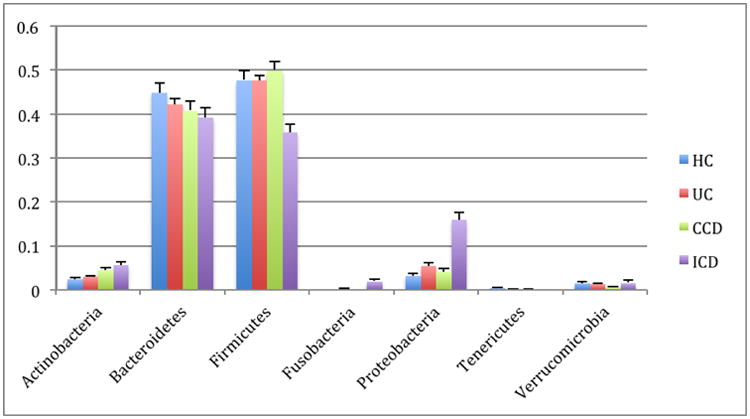
Seven most abundant phyla shown. HC=healthy controls, UC=ulcerative colitis, CCD=colonic Crohn's disease, ICD=ileal Crohn's disease. Error bars indicate standard error of the mean.