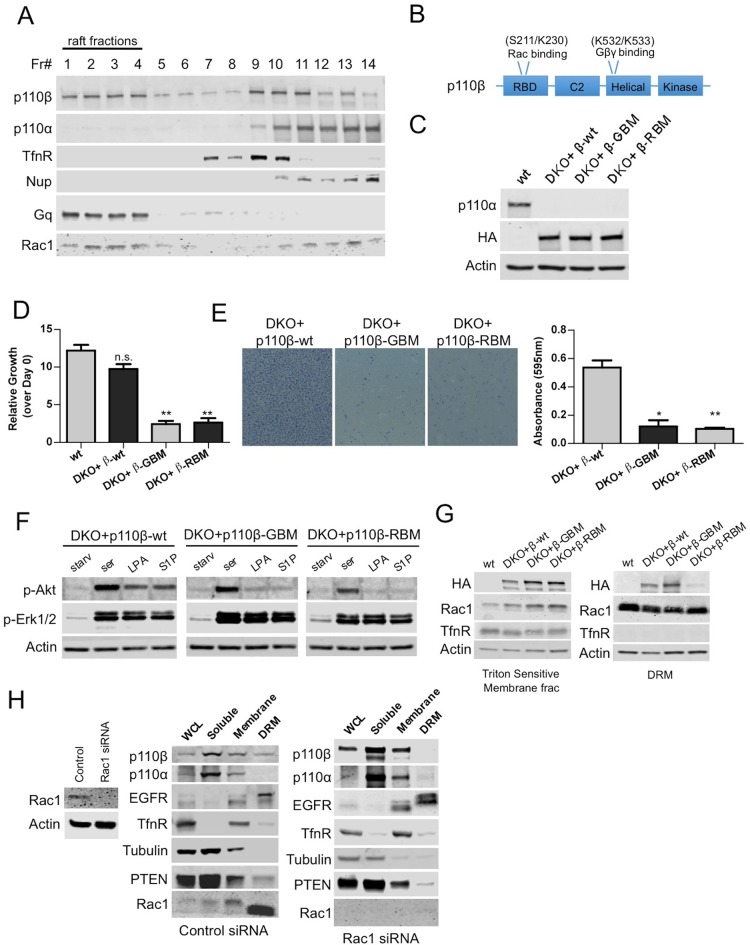
Figure 2. Rac1 binding domain constitutes a raft localization signal for p110β.
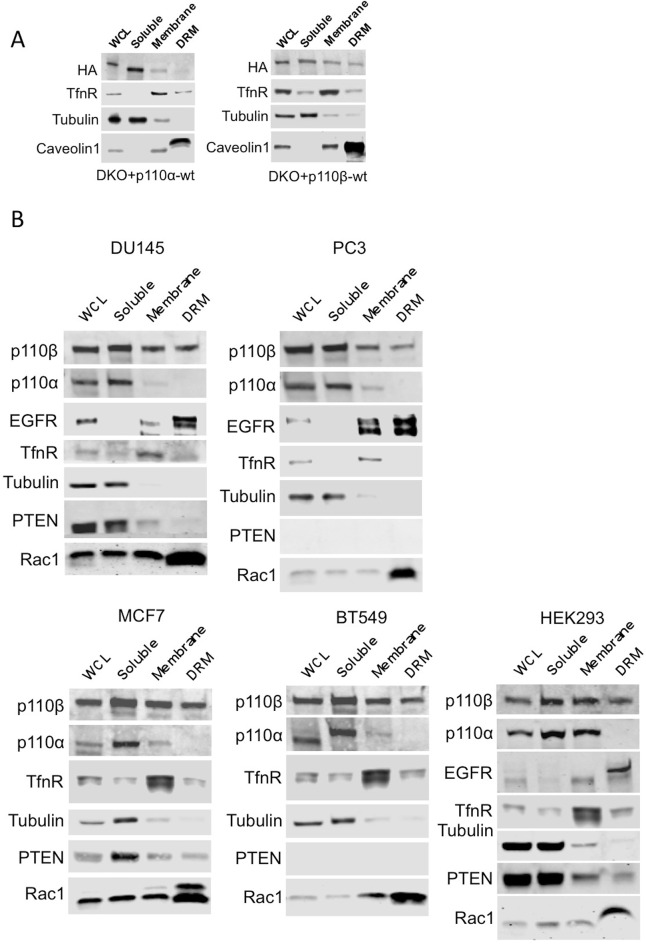
(A) Detergent-free fractionation of HMECs on an Opti-prep gradient followed by western blots with the indicated antibodies. TfnR (transferrin receptor); marker for nonraft membranes. Nup (nucleoporin); marker for nuclear membranes. Gq; marker for membrane rafts. (B) Graphical depiction of the functional domains of p110β including the residues responsible for Rac1 and Gβγ interaction. (C) Wt, DKO+p110β-wt, DKO+p110β-Gβγ binding mutant (GBM) and DKO+p110β-Rac1 binding mutant (RBM) MEF samples were processed to determine levels of p110α and p110β expression. (D) The indicated cells were grown in 8% FBS-DMEM and cellular proliferation was assessed after a week. Error bars indicate standard deviation in 3 independent experiments. **p<0.01, n.s. (not significant), p>0.05. (E) The indicated MEFs were analyzed for migration across transwell inserts; cells were detected with crystal violet staining. On the right, MEFs were quantified for migration through the transwell in 3 independent experiments with standard deviation. *p<0.05, **p<0.01. (F) The indicated MEFs were starved and stimulated with serum or GPCR agonists LPA and S1P. p-Akt (for T308) displays level of Akt activation and p-Erk1/2 depicts activation of MAPK pathway. (G) Indicated cells were fractionated into soluble, triton sensitive and triton resistant fractions. Triton soluble and resistant (DRM) fractions were analyzed in immunoblots; anti-HA antibodies were used to visualize the abundance of the p110β variants in those fractions. Anti-Rac1 antibody was used to demonstrate raft enrichment, whereas anti-TfnR immunoblot depicts enrichment of nonraft membranes. Anti-actin serves as loading control. (H) On the left, HMECs transfected with either control or Rac1 specific siRNAs were lysed and processed for western blot. On the right, siRNA treated cells were fractionated. WCL were analyzed to display overall levels of protein expression. Soluble, triton soluble (membrane) and triton resistant membrane fractions (DRM) were analyzed in immunoblots; Anti-Rac1 antibodies were used to assess level of Rac1 knock-down. Anti-EGFR antibodies were used as markers for DRM fractions, whereas anti-TfnR immunoblot depicts enrichment of nonraft membranes. Anti-tubulin immunoblot serves as a marker for soluble fractions.


