. 2016 Oct 4;5:e17635. doi: 10.7554/eLife.17635

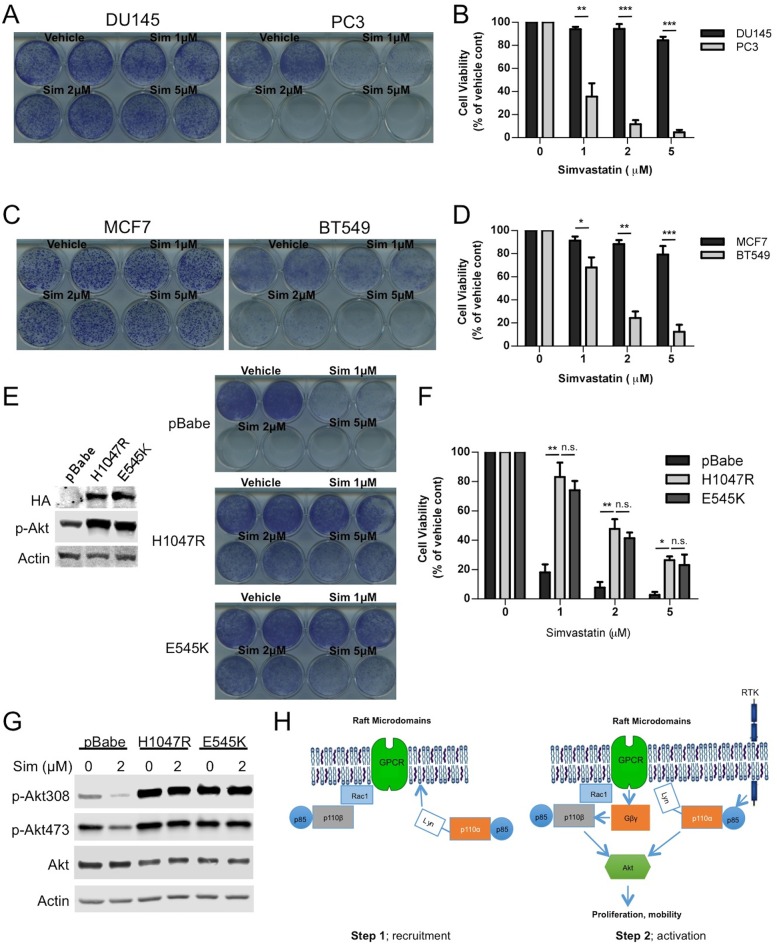
Figure 7. Raft dependent PI3K function is critical for PTEN null cancer cells.

(A) DU145 and PC3 prostate cancer cell lines were seeded on 12-well plates and were treated with indicated doses of simvastatin for a week. Crystal violet assays determined the extent of cell growth. (B) Quantification of cellular proliferation assays in (A), graph displays mean of 3 independent experiments with standard deviation. **p<0.01, ***p<0.001. (C) MCF7 and BT549 breast cancer cell lines were seeded on 12-well plates and were treated with indicated doses of simvastatin for a week. Crystal violet assays determined the extent of cellular growth. (D) Quantification of cellular proliferation assays in (C), graph depicts mean of 3 independent experiments with standard deviation. *p<0.05, **p<0.01, ***p<0.001. (E) PC3 cells expressing empty control plasmid, p110α-H1047R and p110α-E545K vectors processed for western blot analysis with the indicated antibodies. (F) Indicated cells were treated with increasing doses of simvastatin for a week. Crystal violet assays determined the extent of cellular growth. (G) Quantification of cellular proliferation assays in (F), graph depicts mean of 3 independent experiments with standard deviation. *p<0.05, **p<0.01, n.s. p>0.05. (H) Biochemical analysis of PC3 cells in (E) treated with 2 μM simvastatin for 36 hr. Anti-p-Akt immunoblots on T308 and S473 display level of Akt activation. Anti-Akt and anti-actin antibodies were used as loading control. (I) Model representing PI3K signaling downstream of GPCRs in a two-step process. Rac1 mediates raft recruitment of p110β while p110α is elusive from rafts under physiological conditions. Once localized to GPCR signaling permissive membrane microdomains, either p110α or p110β can be activated via distinct mechanisms; p110α activity can be triggered via lateral activation of EGFR by GPCRs, whereas p110β can be activated via the canonical Gβγ pathway.

DOI: http://dx.doi.org/10.7554/eLife.17635.013

Figure 7.

Figure 7—figure supplement 1. Critical dependency of PTEN null cancer cell lines to raft associated PI3K signaling.

Figure 7—figure supplement 1.

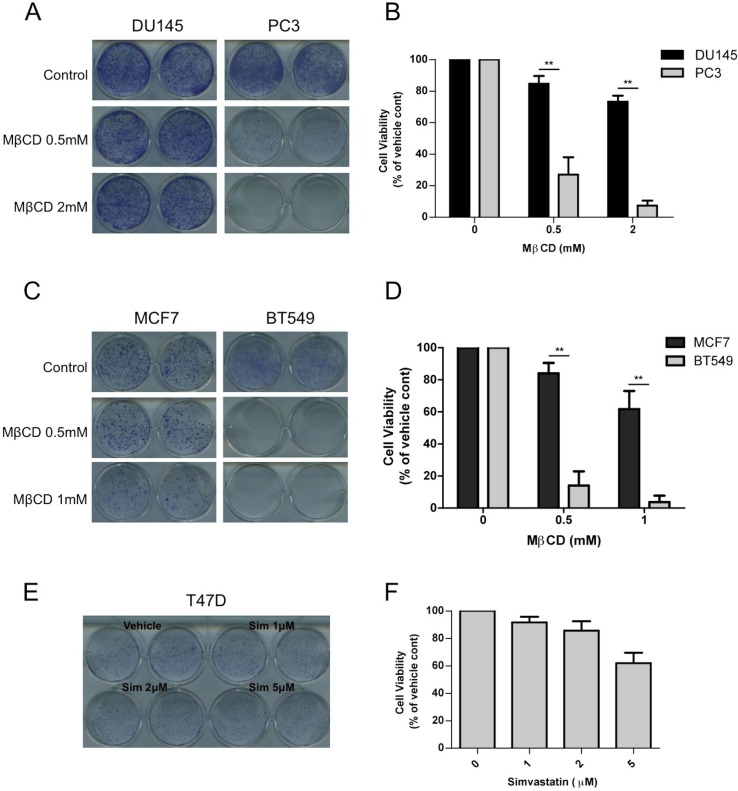
(A) DU145 and PC3 prostate cancer cells were seeded on 12-well plates and treated with indicated doses of MβCD for seven days. Crystal violet assays determined the extent of cell growth. (B) Quantification of cellular proliferation assays in (A), graph displays mean of 3 independent experiments with standard deviation. **p<0.01. (C) MCF7 and PC3 breast cancer cells were seeded on 12-well plates and treated with indicated doses of MβCD for seven days. Crystal violet assays determined the extent of cell growth. (D) Quantification of cellular proliferation assays in (C), graph displays mean of 3 independent experiments with standard deviation. **p<0.01. (E) T47D breast cancer cells were seeded on 12-well plates and were treated with indicated doses of simvastatin for seven days. Crystal violet assays determined the extent of cell growth. (F) Quantification of cellular proliferation assays in (E), graph displays mean of 3 independent experiments with standard deviation.
Figure 7—figure supplement 2. PTEN null cancer lines become sensitized to simvastatin upon re-expression of wild-type PTEN.

Figure 7—figure supplement 2.

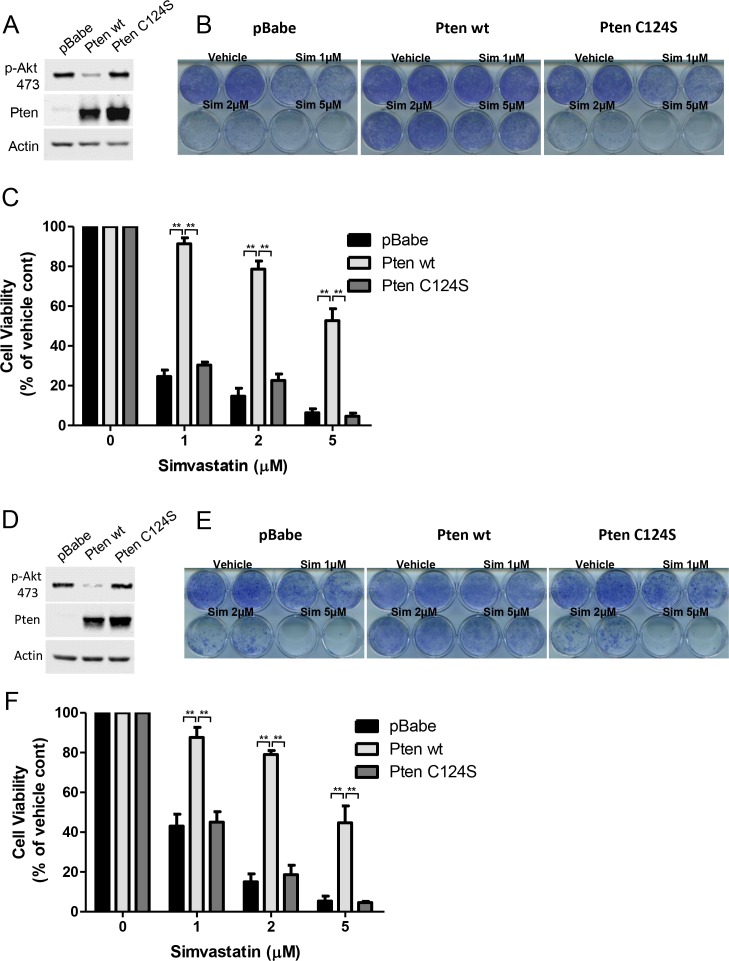
(A) PC3 cells expressing empty control plasmid, PTEN wt and PTEN C124S were processed for western blot analysis with the indicated antibodies. (B) PC3 cells in (A) were seeded on 12-well plates and treated with indicated doses of simvastatin for seven days. Crystal violet assays determined the extent of cell growth. (C) Quantification of cellular proliferation assays in (B), graph displays mean of 3 independent experiments with standard deviation. **p<0.01. (D) BT549 cells expressing empty control plasmid, PTEN wt and PTEN C124S were processed for western blot analysis with the indicated antibodies. (E) BT549 cells in (D) were seeded on 12-well plates and treated with indicated doses of simvastatin for seven days. Crystal violet assays determined the extent of cell growth. (F) Quantification of cellular proliferation assays in (E), graph displays mean of 3 independent experiments with standard deviation. **p<0.01.