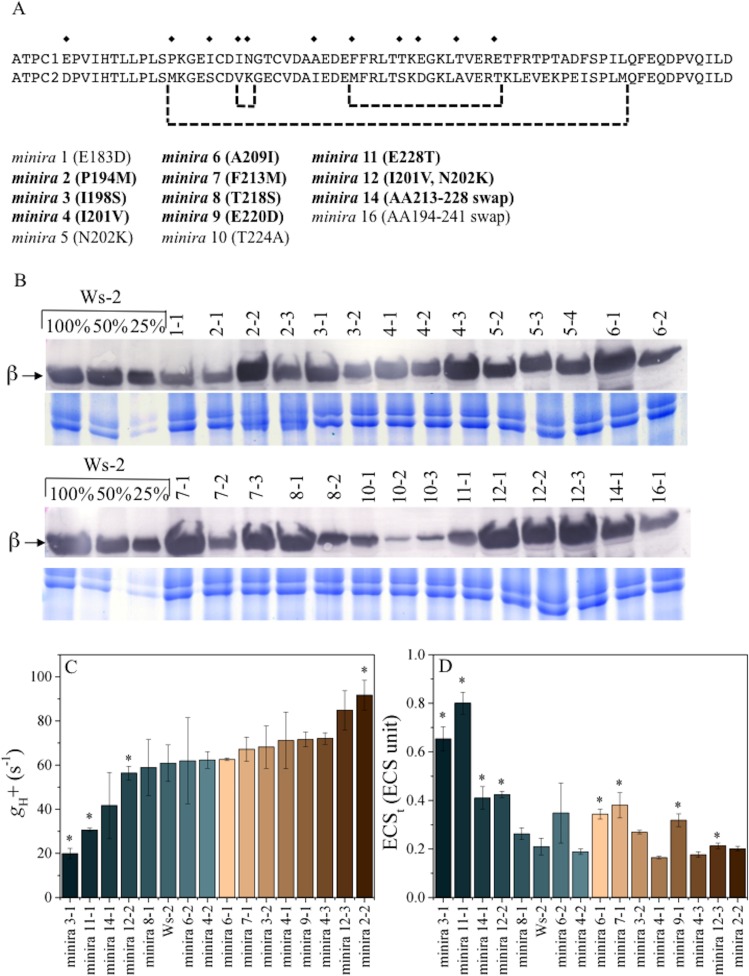
Figure 1. γ-subunit mutations alter photosynthetic proton efflux.
Sequence alignment of Arabidopsis ATPC1 and ATPC2 regulatory region (A). Amino acid differences incorporated into ATPC1 to generate minira are indicated by symbols (♦). Amino acid numbers are based on standard spinach positions, which minira numeric designations are based upon position within the amino acid primary sequence. Regions where multiple changes were incorporated from ATPC2 are outlined in brackets. Bold: mutations resulting in successful transgenic plants with stable phenotypes utilized for experiments. Accumulation of chloroplast ATP synthase complexes was verified across resulting transformant lines (B). Total leaf protein was probed for chloroplast ATP synthase β-subunit compared to a titration of wild type (Ws-2) accumulation. Gels run with identical samples stained with Coomassie Brilliant Blue are shown below to ensure equal loading to the 100% wild type samples. The conductivity of the ATP synthase for protons (gH+, C) and the light-driven pmf (ECSt, D), calculated from the decay of the electrochromic shift at 100 μmol photons m−2s−1 actinic light (mean ± s.d, n = 3). Statistically significant differences (*p<0.05) from wild type were determined using a t-test. ECS units were defined as the deconvoluted ΔA520 μg chlorophyll−1 cm2.

