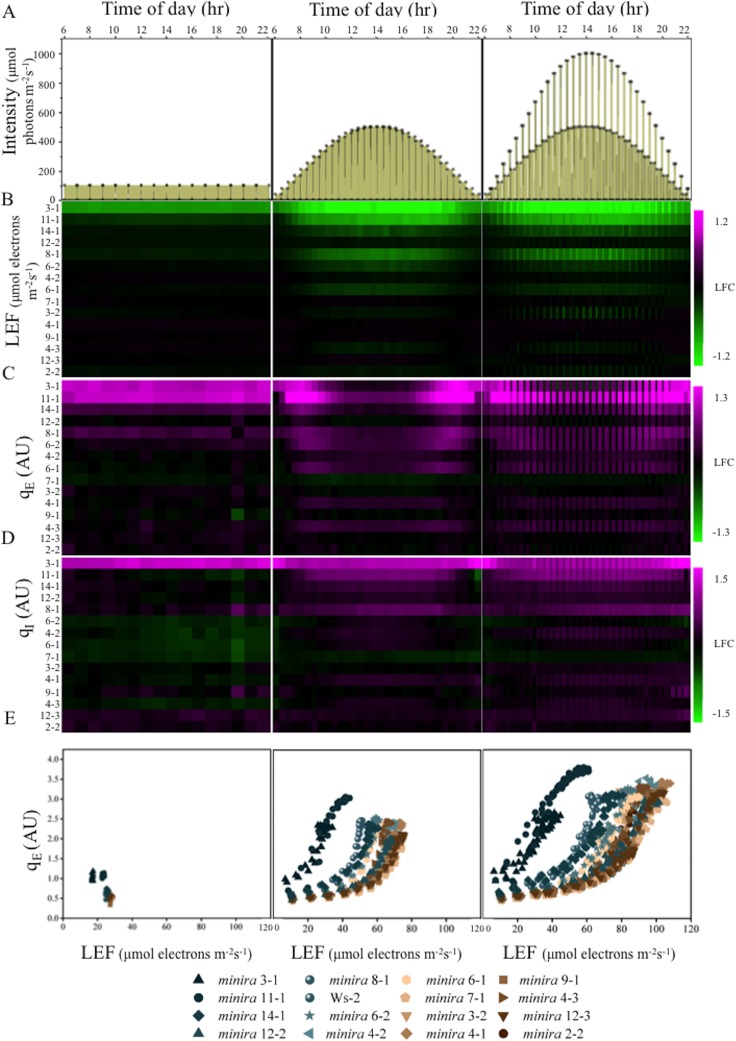
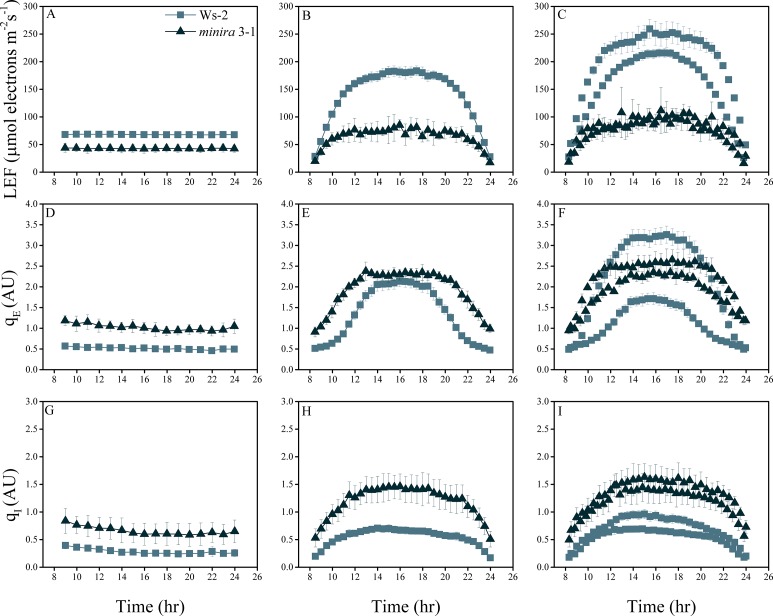
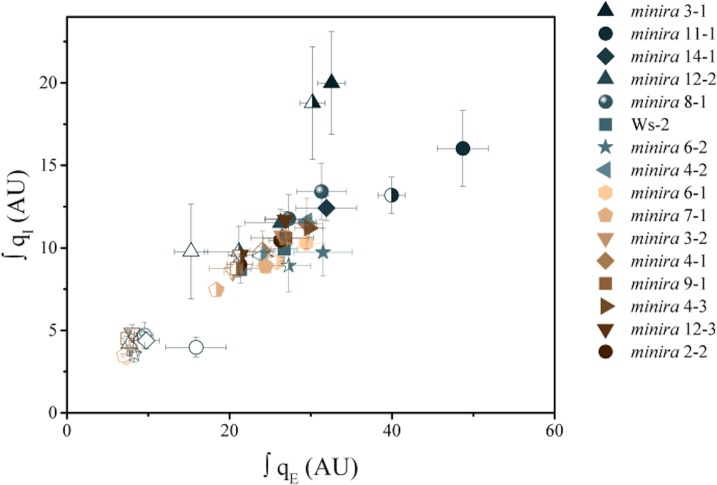
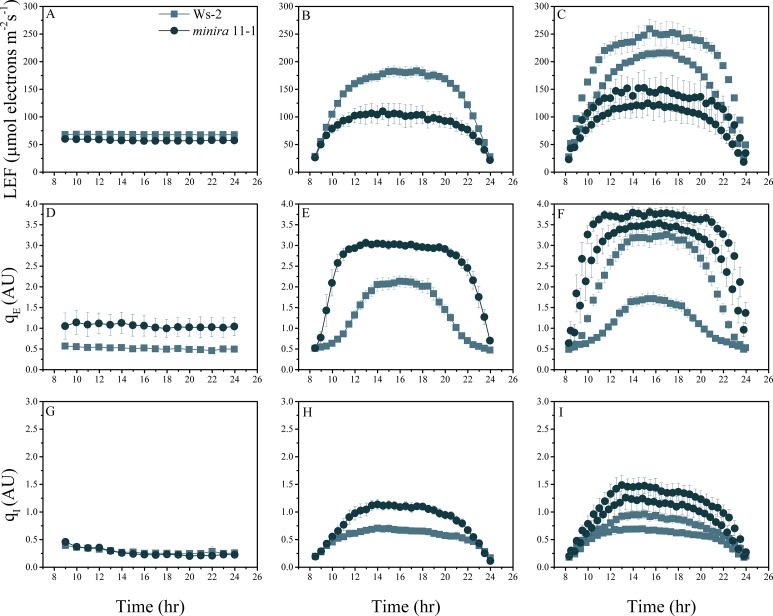
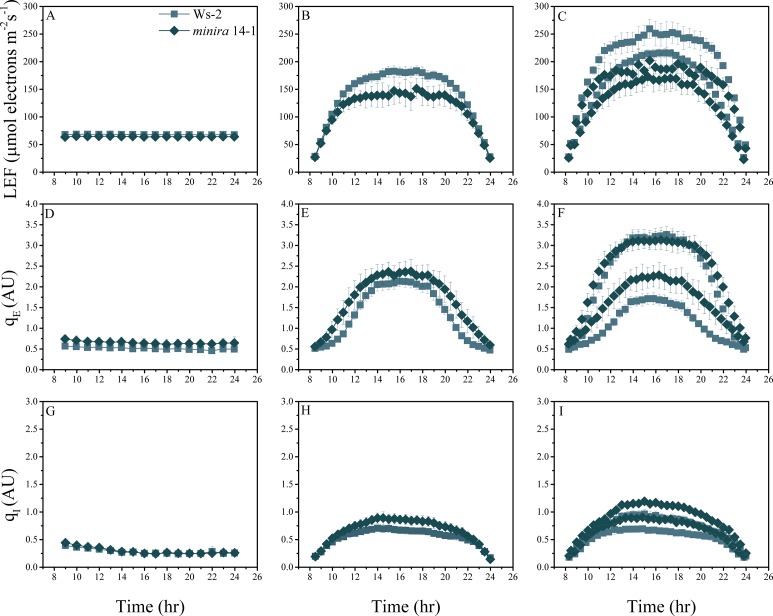
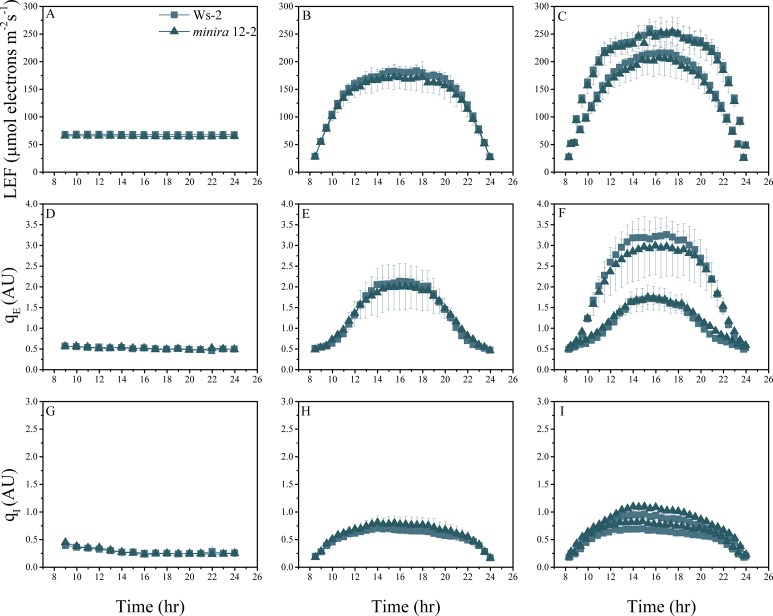
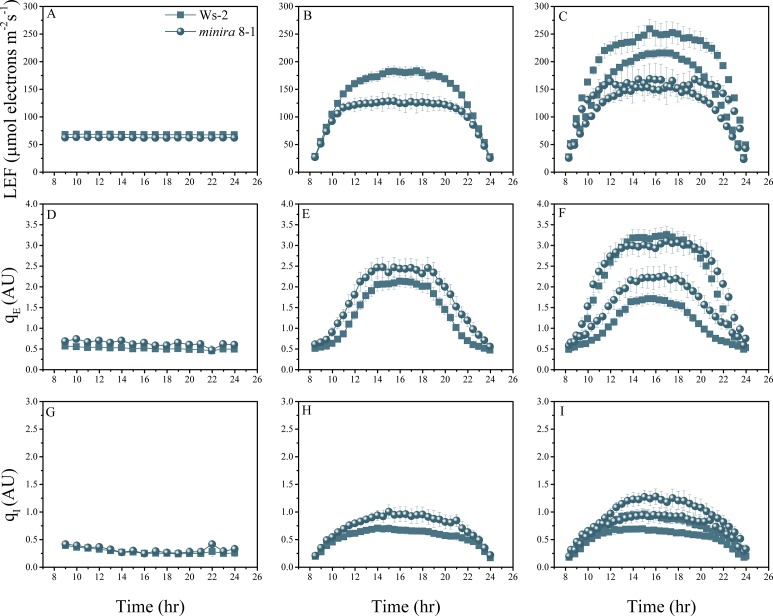
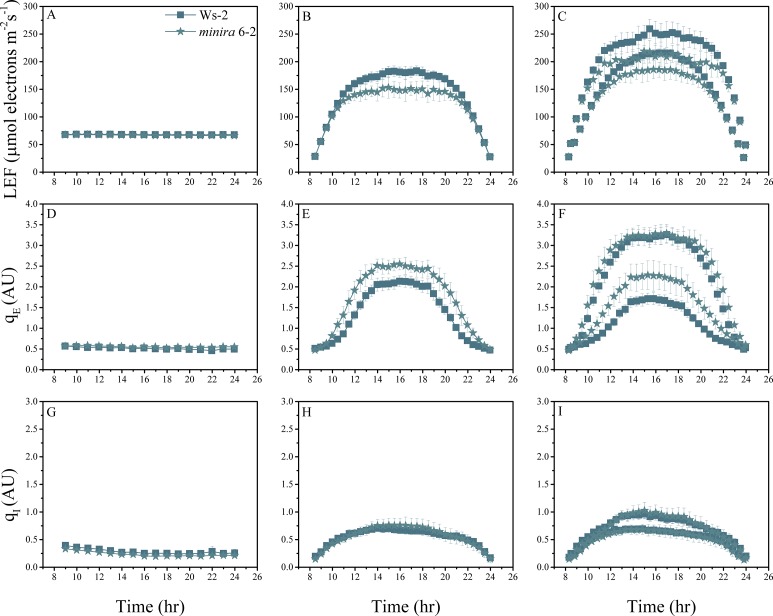
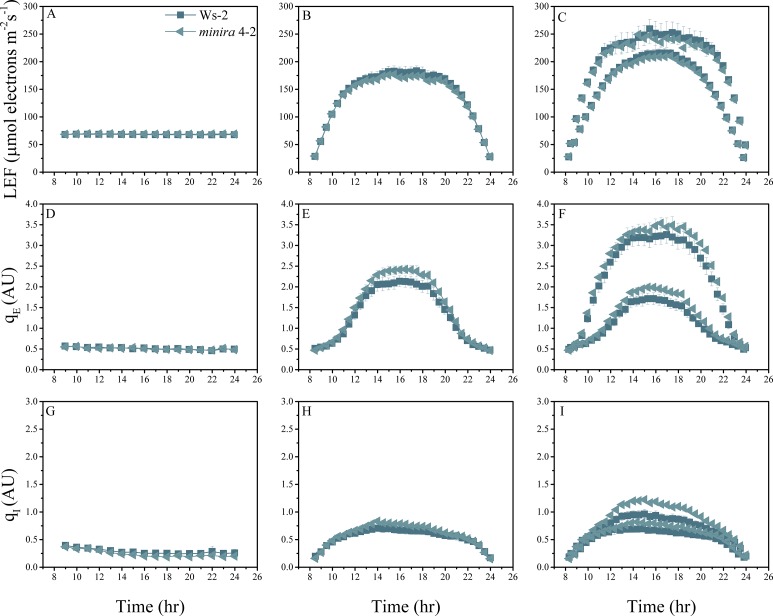
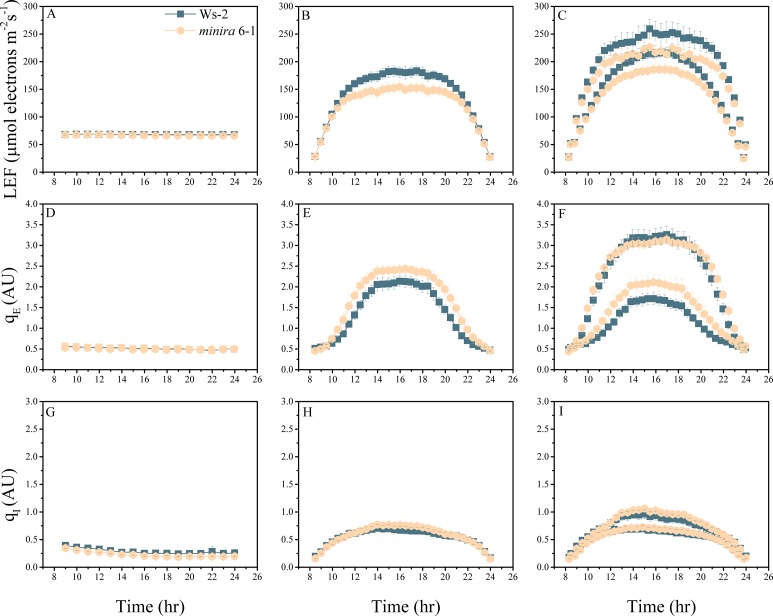
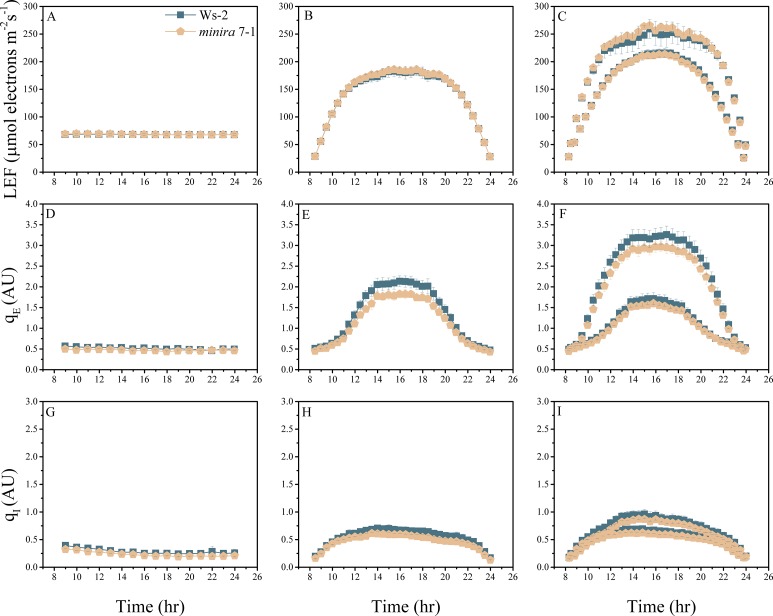
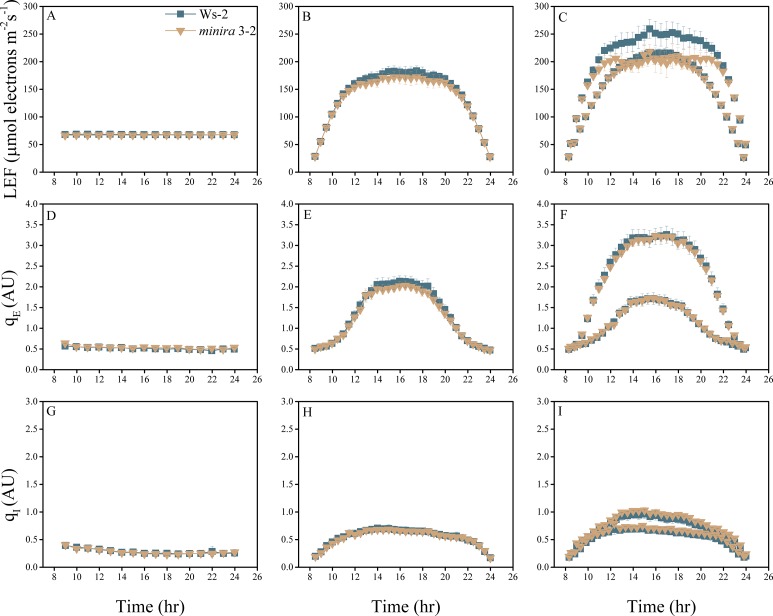
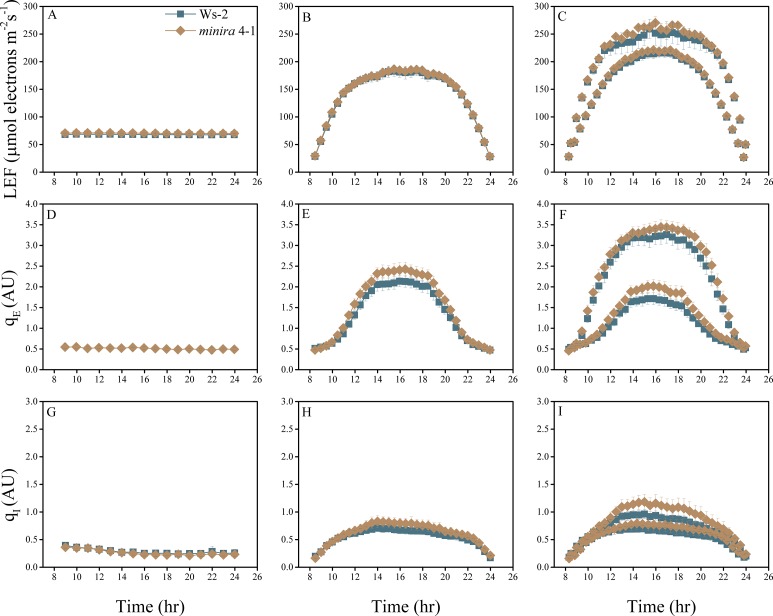
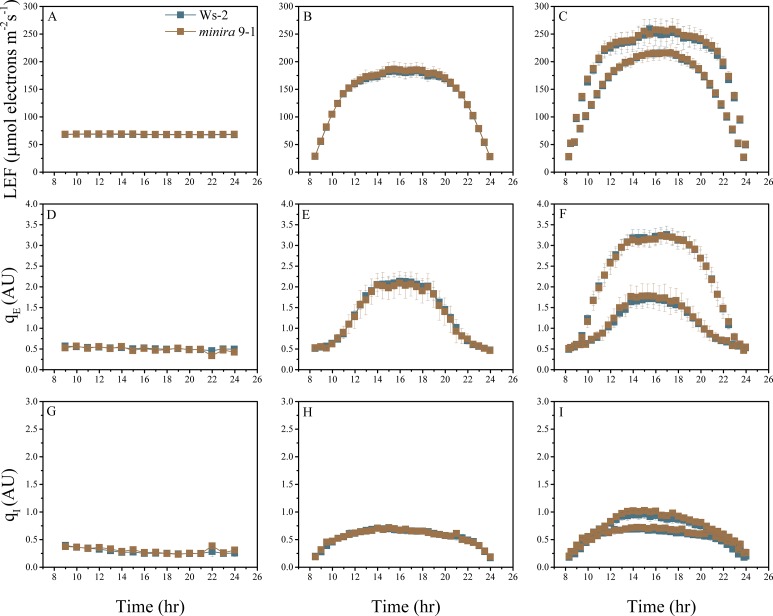
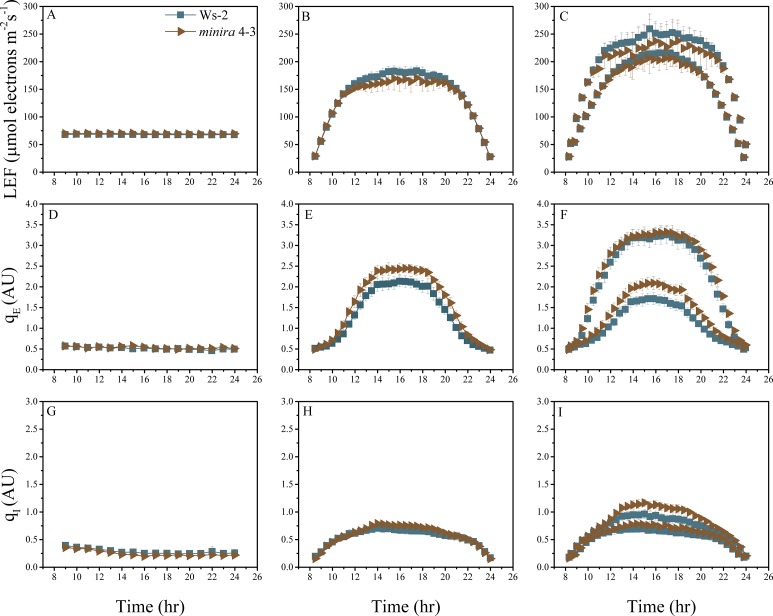
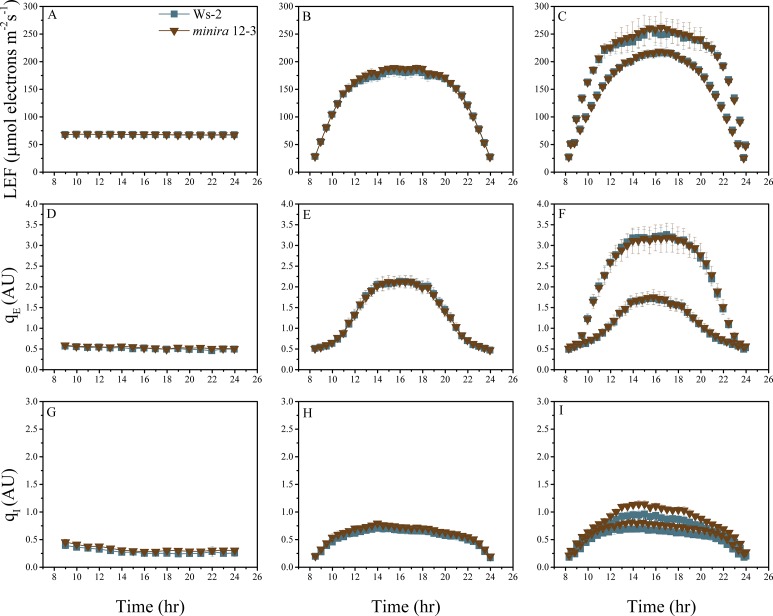
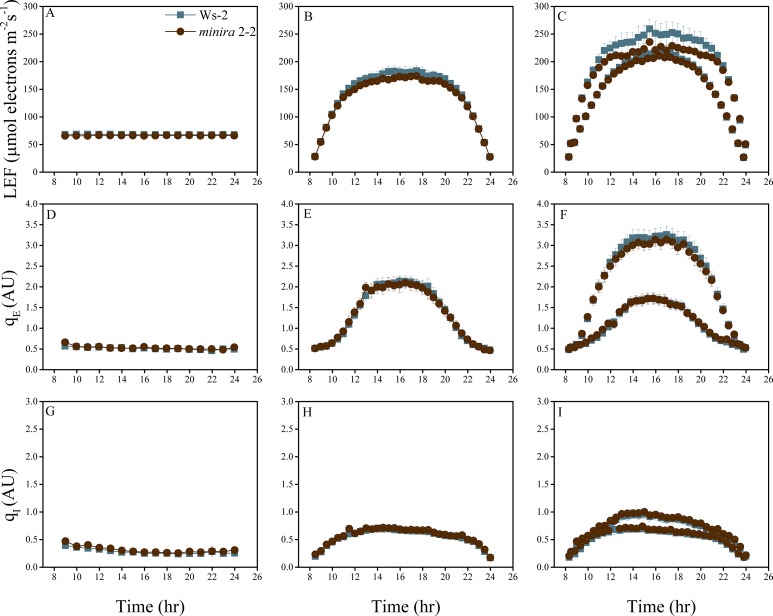
Figure 2. Dynamic light conditions enhance pmf dependent phenotypes.
Whole plant fluorescent images were captured over three days under the illumination conditions displayed in Panel A and listed in Supplementary file 2. Plants were illuminated over the 16-hr photoperiod, shown as yellow filled areas representing the light intensity when present in A, under either a constant light intensity (day one), a sinusoidal photoperiod (day two), or a sinusoidal photoperiod interrupted by fluctuations in light intensity (day three). Square symbols in Panel A indicate each light intensity change. Steady-state fluorescence parameters were captured for each plant at the end of each light condition. Panels B,C and D represent the responses of LEF, qE and qI respectively (n ≥ 3). Data are shown as log2-fold changes compared to the wild type. Kinetic data including wild type are shown in Figure 2—figure supplements 1–15. The rows were sorted in order of ascending gH+ values measured as in Figure 1C. Panel E plots the dependence of the mean (n ≥ 3) of qE against the linear electron flow (LEF) for each time point measured for the day. For visualization purposes the error bars have been omitted from E.

