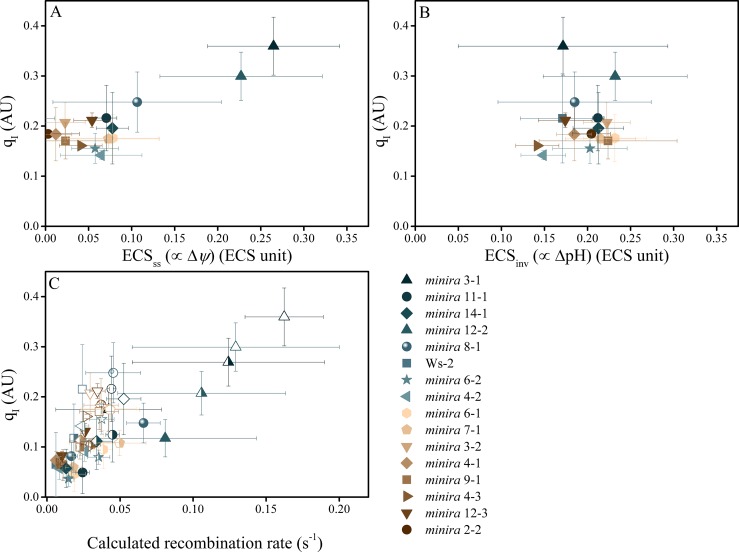
Figure 5. Photoinhibition is strongly correlated with Δψ but not ΔpH in minira lines.
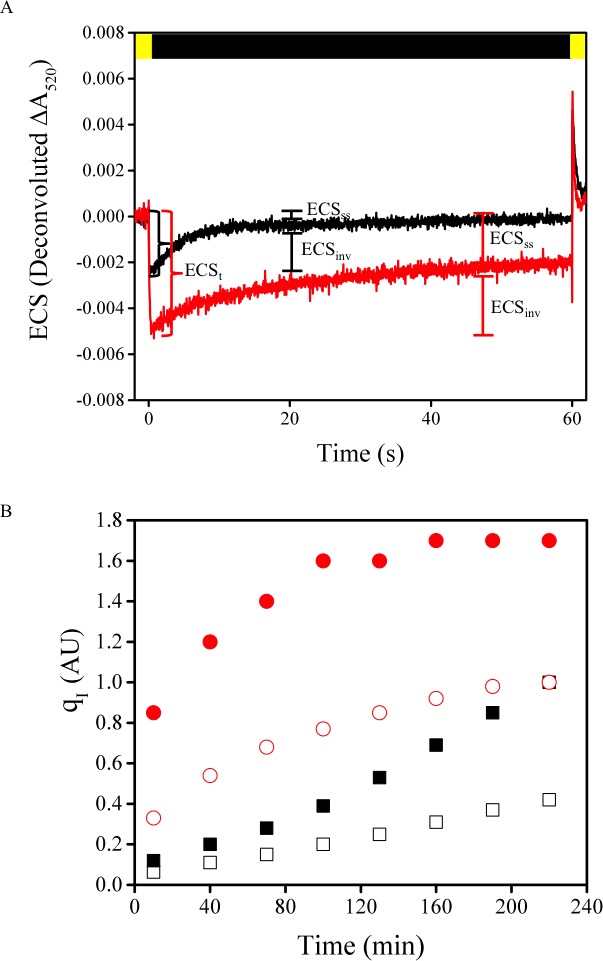
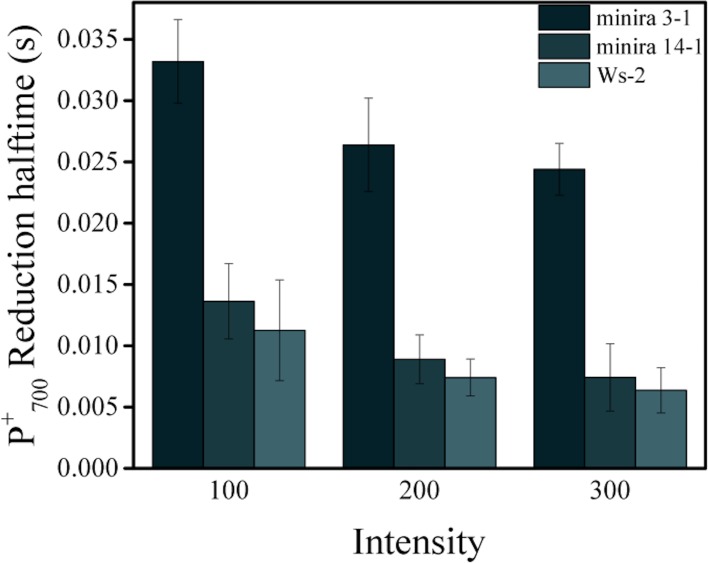
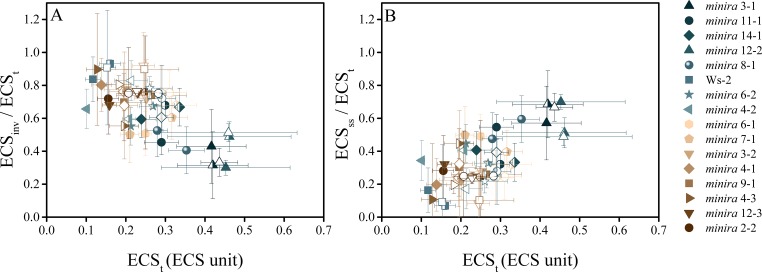
Photoinhibition, estimated by the qI fluorescence parameter, is plotted against either the ΔpH or Δψ components of pmf, estimated by the ECSss (A) and ECSinv (B) parameters, as described in Materials and methods. Measurements shown were taken during exposure to 500 μmol photons m−2s−1 actinic light (mean ± s.d., n = 3). Two-way analysis of variance (ANOVA) of all combined data, 15 minira lines and wild type, showed a stronger correlation between qI and Δψ (F = 9.5, p=0.003) than ΔpH (F = 4.05, p=0.05). This correlation is also seen with the expected pH-dependent alterations of P700+ reduction for the observed partitioning differences from wild type (Figure 5—figure supplement 1) and an increase in the fraction of total pmf stored as Δψ at the expense of ΔpH over multiple light intensities (Figure 5—figure supplement 2). Increased storage of pmf as Δψ is also observed in tobacco ATP synthase knock-down plants (Figure 5—figure supplement 3). ECS units were defined as the deconvoluted ΔA520 μg chlorophyll−1 cm2. The influence of Δψ on the rate of PSII recombination was estimated based on the change in the equilibrium constant for the sharing of electrons between pheophytin and QA (described in Materials and methods) (C). The influence of Δψ on the calculated recombination rate taking into account the fraction of reduced QA using the equations described in Materials and methods and described in the main text. Data were obtained at 100 (solid symbols), 300 (half filled symbols), and 500 μmol photons m−2s−1 (open symbols) (mean ± s.d., n = 3).
Figure 5—figure supplement 1. Reduction kinetics of P700+.
Figure 5—figure supplement 2. The electric field component of the pmf dominates under high pmf conditions.
Figure 5—figure supplement 3. Tobacco ATPC1 antisense knockdown increase Δψ partitioning under high pmf conditions.


