. 2016 Oct 4;5:e16921. doi: 10.7554/eLife.16921

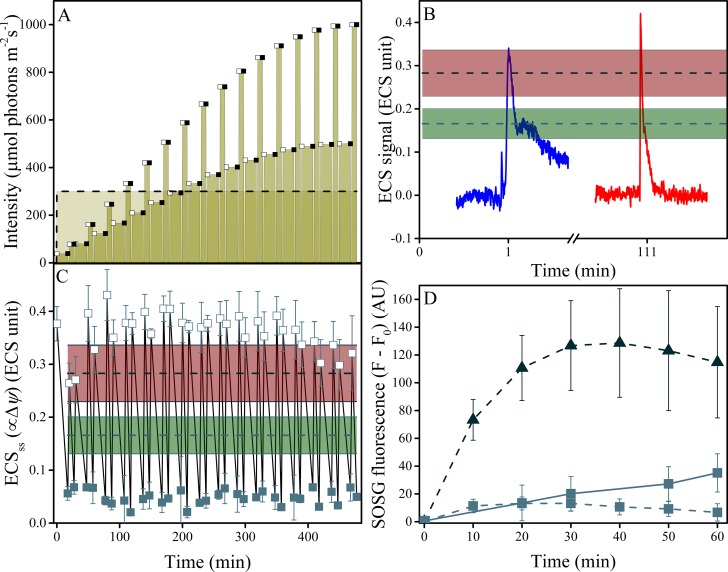
Figure 7. Induction of Δψ and 1O2 production under fluctuating light in wild type plants.

(A) Illumination conditions and measurement points used in the experiments. Fluctuating light conditions (replicating Figure 2 day three) are shown as connected points, with open squares representing measurements obtained 10 s after the light transition and closed squares the end of steady-state illumination. Constant illumination of 300 μmol m−2s−1 is represented as a dotted line. (B) Representative traces of the light-fluctuation induced ECS signals resulting in transient ECS 'spikes' are shown for the first fluctuation (dark to 39 μmol m−2s−1, blue) and the fluctuation from 167 to 333 μmol m−2s−1, red). A full set of ECS kinetic 'spikes' following increased light fluctuations can be found in Figure 7—figure supplement 2. The extents of light-induced Δψ in wild type (green line and shaded box, indicating mean ± s.d) and minira 3–1 (red lines and box, indicating mean ± s.d) at 300 μmol m−2s−1 are shown for comparison. (C) The extents of light-induced Δψ, estimated using the ECSss parameter over the time-course of the fluctuating light experiment, compared to those obtained under continuous illumination in wild type and minira 3–1 (green and red lines and boxes, respectively, as in Panel B). Open and closed squares correspond to the ECSss measurements taken at the timing designated in panel A. (D) Time-course of SOSG fluorescence changes for wild type (squares) and minira 3–1 (triangles) during exposure to constant 300 μmol m−2s−1 (dotted lines)and wild type leaves under the first hour of fluctuating light (solid line). A decrease in SOSG fluorescence occurs when Δψ is collapsed with the addition of the ionophore valinomycin (Figure 7—figure supplement 1). All data in A, B, and C represent mean (n ≥ 3) ± s.d. ECS units were defined as the deconvoluted ΔA520 μg chlorophyll−1 cm2.

DOI: http://dx.doi.org/10.7554/eLife.16921.036

Figure 7.

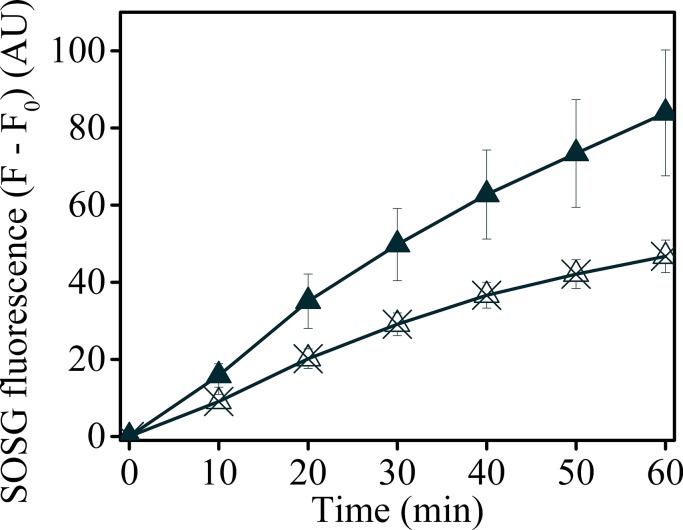
Figure 7—figure supplement 1. Uncoupling Δψ decreases SOSG fluorescence in minira 3–1.

Figure 7—figure supplement 1.

Minira 3–1 leaves were vacuum infiltrated with either SOSG (solid triangles) or SOSG and 50 μM valinomycin (crossed triangles) to decrease the photosynthetic Δψ. Leaves were illuminated at a constant 100 μmol m−2s−1 intensity and SOSG fluorescence detected for 60 min.

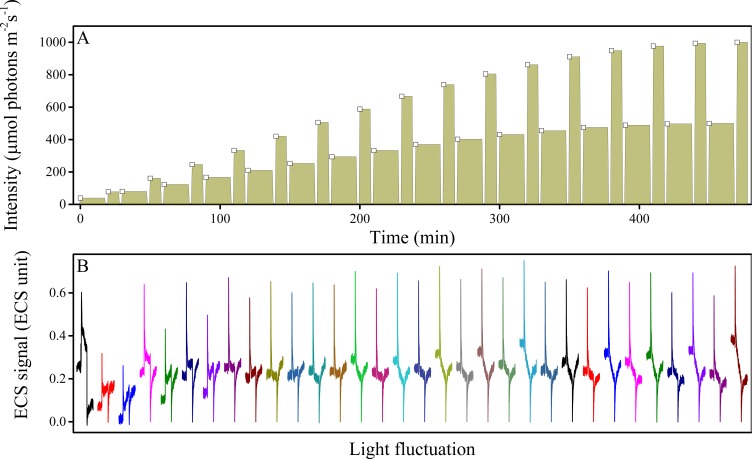
Figure 7—figure supplement 2. Fluctuations in light intensity result in transient ECS spikes.

Figure 7—figure supplement 2.

Wild type plants were measured under fluctuating light (A) and the ECS measurements taken 10 s after each intensity fluctuation from lower to higher light (A, open squares). The resulting deconvoluted ΔA520 nm ECS signals show rapid, transient ECS 'spikes' induced by rapid Δψ transients before the ΔpH component can be altered (B). The upward spike represents the effect of rapidly increasing the light intensity. The downward spikes seen towards the ends of the traces reflect the transients that occur when the actinic light is switched to the lower light intensity at the end of the fluctuation. A rough estimate of the extent of the Δψ imposed by the spikes can be obtained by comparing the ECS signals with the calibration and results presented in Takizawa et al. (2007), which estimated that the Δψ imposed by a saturating, single-turnover flash to thylakoids was about 40 mV. Based on this calibration value, the extent of basal pmf formed by equilibration with ATP (i.e. the dark pmf level or pmfd) was estimated to be about 112 mV (Takizawa et al., 2007), 60 mV of which is stored in Δψ if the partitioning is 0.5. From the dark-interval relaxation kinetics of ECS under steady-state conditions (see Figure 7B and Figure 5—figure supplement 1), we then expect an additional light-driven pmf under steady-state conditions to range from 150–200 mV, and given that the fraction of this pmf stored as Δψ ranged from 0.20–0.60, we estimate a range for steady-state light-driven Δψ between 30 and 120 mV. The transient spikes in Δψ generated during light fluctuations are likely to be essentially all stored in Δψ (see main text) and range in amplitude between 60–80 mV, so that the highest amplitude Δψ imposed during these conditions likely falls in the broad range between 150–260 mV. ECS units were defined as the deconvoluted ΔA520  μg chlorophyll−1 cm2