. 2016 Oct 4;5:e16118. doi: 10.7554/eLife.16118

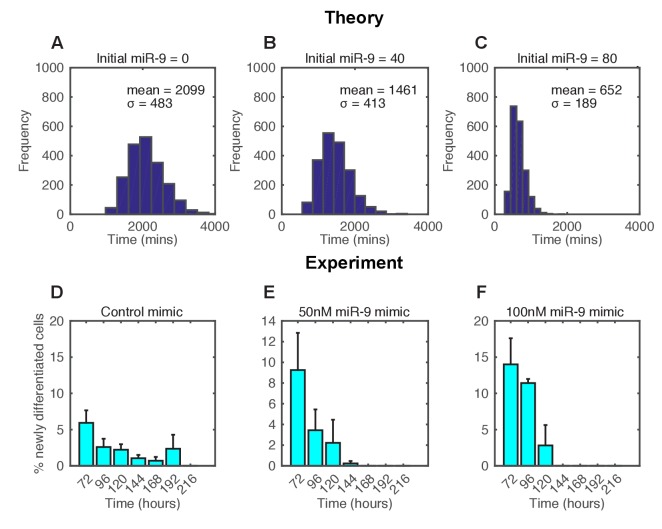
Figure 6. The spread of time-to-differentiation decreases in both the computational model and experiments with increased initial miR-9.

(A, B, C) The distribution of times to reach the low HES1 state of 3000 simulations using initial conditions of miR-9 r(0) = 0, 40 and 80, respectively. The initial conditions of mRNA and protein were m(0) = 20xΩ, p(0) = 400xΩ. All simulations performed with parameter set 2 (Appendix 1—table 1) with system size Ω = 1 and using the CLE. (D, E, F) Newly differentiated Tuj1 positive C17.2 cells compared to previous time point as a percentage of the population. Cells were transfected with 100 nM control mimic or 50 nM and 100 nM miR-9 mimic, respectively. Cells were cultured in serum-free differentiation conditions for the time shown. 5 images analysed per condition in at least 2 experiments. MATLAB code and experimental data contained in Figure 6—source data 1.

DOI: http://dx.doi.org/10.7554/eLife.16118.026

Figure 6—source data 1. MATLAB code to simulate timing to differentiation with different initial conditions of miR-9.
Includes experimental data for the spread of differentiation of C17.2 cells.
DOI: 10.7554/eLife.16118.027
Figure 6—source data 2. Data for the speed up of differentiation in C17.2 cells with added miR-9.
DOI: 10.7554/eLife.16118.028
Figure 6—source data 3. Data for the speed up of differentiation in NS cells measured with FACS.
DOI: 10.7554/eLife.16118.029

Figure 6.

Figure 6—figure supplement 1. Increased miR-9 shifts timing of differentiation earlier in C17.2 neural progenitor cells.

Figure 6—figure supplement 1.

(A) Percentage of Tuj1 positive neurons in differentiated C17.2 cells after transfection of 50 nM miR-9 mimic or control mimic and culture in serum-free differentiation conditions. Significance tested in one-way ANOVA with Holm-Sidak multiple comparison correction. Significance: *p<0.05; **p<0.01; ***p<0.001. 5 images analysed per condition in 2 biological replicates. Error bars show S.E.M. (B) The density of cells after transfection of negative control mimic or 50 nM and 100 nM miR-9 mimic and culture in serum-free differentiation conditions. No differences within a given time point are statistically significant, where significance is tested in a two-way ANOVA with Tukey multiple comparison correction. Source data contained in Figure 6—source data 2.
Figure 6—figure supplement 2. Increased miR-9 shifts timing of differentiation earlier in NS cells.

Figure 6—figure supplement 2.

(A) Representative flow cytometry plots showing the percentage of GFP positive neurons during neuronal differentiation of Tau-GFP NS cells after transfection of 40 nM miR-9 mimic or control mimic. Time-points represent hours after the onset of neuronal differentiation. SSC: side scatter (B) Frequency of GFP positive neurons following treatment of Tau-GFP NS cells with 40 nM miR-9 mimic or control mimic (n=5 biological replicates). Significance tested in one-way ANOVA with Holm-Sidak multiple comparison correction. Significance: *p<0.05; **p<0.01; ***p<0.001.Error bars show S.E.M. Source data contained in Figure 6—source data 3.