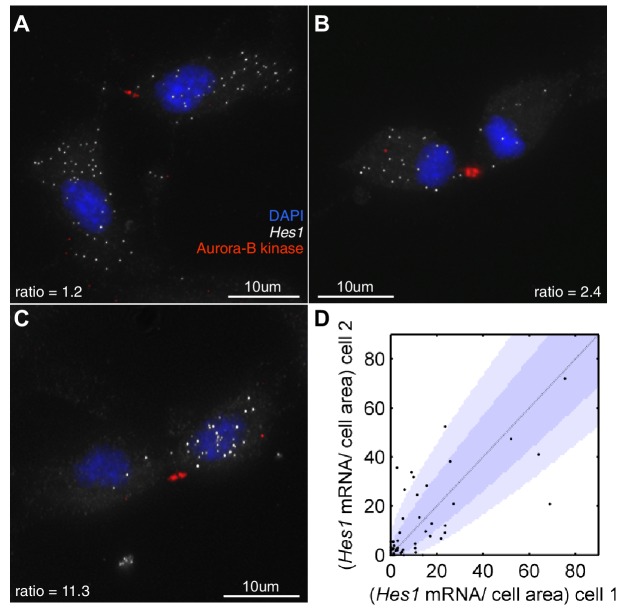
Figure 8. Hes1 mRNA is inherited unequally at cell division.
(A, B, C) smFISH with an exonic Hes1 probe showing asymmetry in Hes1 mRNA number (white) between sister NS cells, just prior to their complete separation at cytokinesis. Aurora-B kinase antibody staining (red) marks the midbody at cytokinesis; nuclei are DAPI stained (blue). (D) Quantification of Hes1 mRNA to cell area ratios between sister cells from 51 NS cell divisions at cytokinesis, from one experiment. Dark blue area represents the 90% confidence bounds that the ratios are drawn from a binomial distribution, where the average amount of mRNA received by each cell is normalised to the relative cell areas. Light blue represents multiple testing Bonferroni corrected 90% confidence bounds that the ratios are drawn from a binomial distribution. mRNA count data contained in Figure 8—source data 1.
DOI: http://dx.doi.org/10.7554/eLife.16118.037

