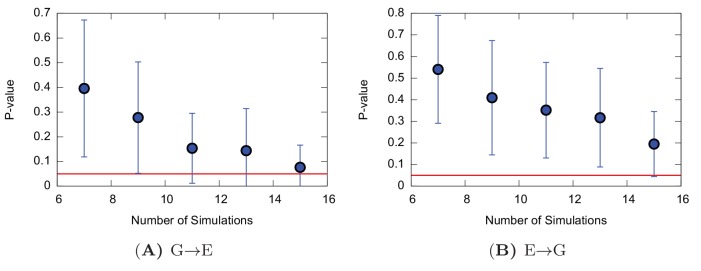
Appendix 1—figure 6. Poisson fit analysis for G to E transitions and E to G transitions of the triple mutant.
The figure shows the p-values of the Poisson fit analysis of G → E (A) and E → G (B) transition times as a function of the size of a subsample of transition times randomly extracted from the main complete sample.

