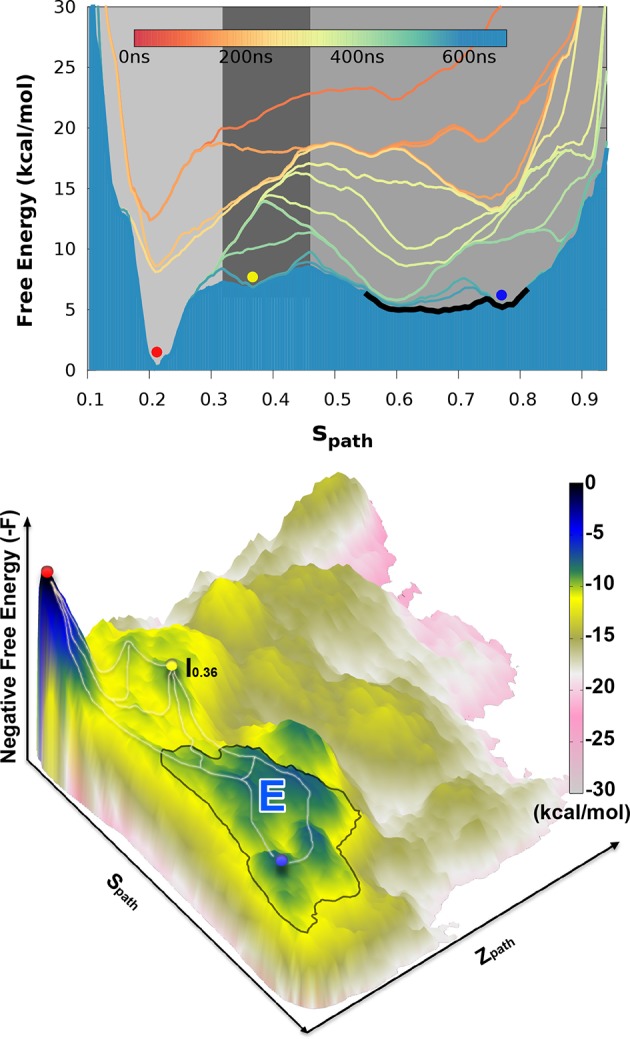
Figure 2. Free energy landscape of the L99A variant of T4L.
In the upper panel, we show the projection of the free energy along , representing the Boltzmann distribution of the force field employed along the reference path. Differently colored lines represent the free energy profiles obtained at different stages of the simulation, whose total length was 667ns. As the simulation progressed, we rapidly found two distinct free energy basins, and the free energy profile was essentially constant during the last 100 ns of the simulation. Free energy basins around and correspond to the previously determined structures of the G- and E-state, respectively (labelled by red and blue dots, respectively). As discussed further below, the E-state is relatively broad and is here indicated by the thick, dark line with ranging from 0.55 to 0.83. In the lower panel, we show the three-dimensional negative free energy landscape, -F(, ), that reveals a more complex and rough landscape with multiple free energy minima, corresponding to mountains in the negative free energy landscape. An intermediate-state basin around and nm2, which we denote , is labeled by a yellow dot.

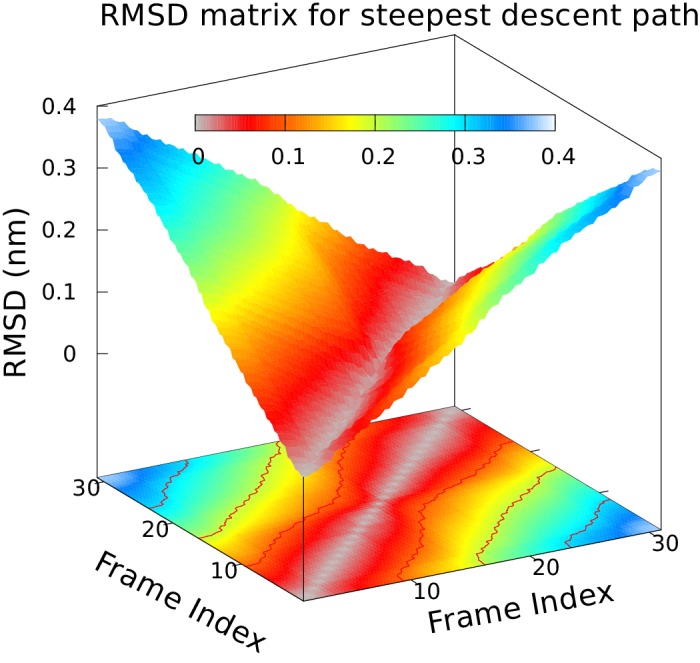
Figure 2—figure supplement 1. Approximately equidistant frames along the reference path.

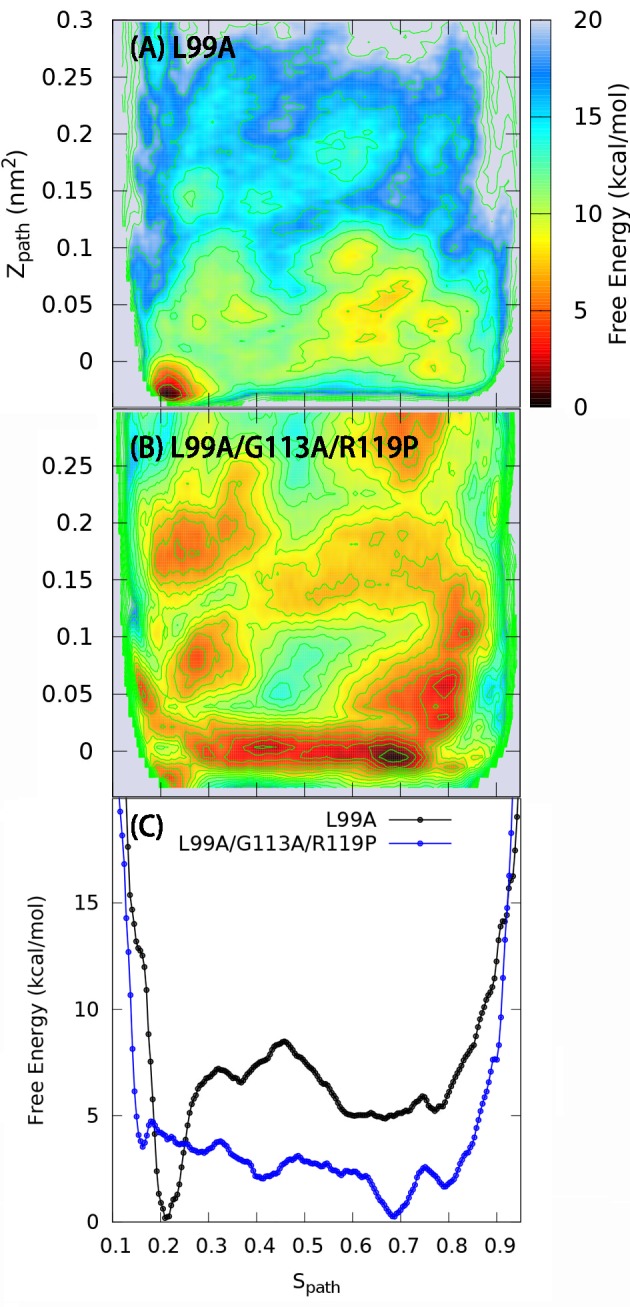
Figure 2—figure supplement 2. One and two dimensional free energy landscape of L99A and the triple mutant.

