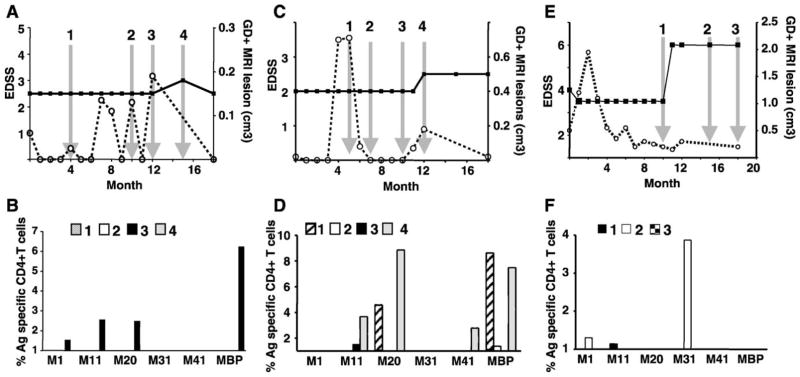
Fig. 4.
Clinical data and myelin-reactivity of T cells from patients 2, 3 and 4. Patient 2: (A) clinical data EDSS (■, solid line) and gadolinium-enhanced brain MRI lesion (○ dashed line). (B) Percentage of CD4+ T cells over the background that proliferated and produced IFN-γ after the culture with different myelin antigens for the time points indicated by the arrows on panel A. Patient 3: (C) clinical data EDSS and GD+ brain lesion. (D) Percentage of CD4+ T cells over the background that proliferated after culture with different myelin antigens (time points are indicated by the arrows on panel C). Patient 4: (E) clinical data EDSS and GD+ brain lesion. (F) Percentage of CD4+ T cells over the background that proliferated after culture with different myelin antigens (time points are indicated by the arrows on panel E).

