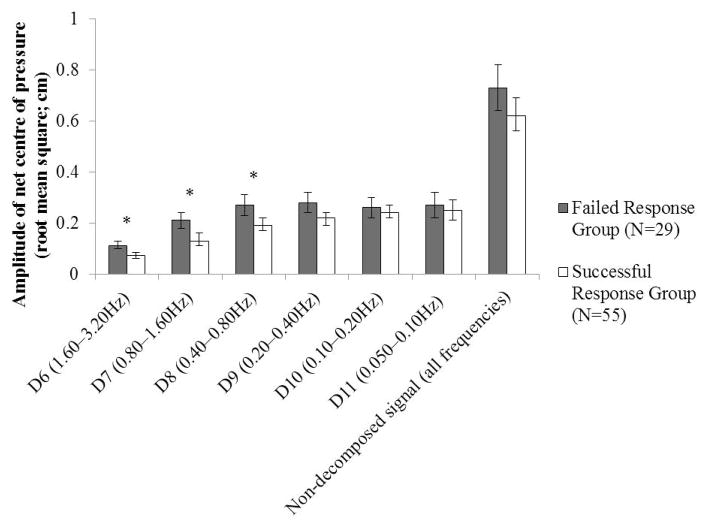
Figure 2.
Mean (95% confidence interval) RMS of net COP values for each level and for the non-decomposed signal, compared between the Failed Response and Successful Response groups (determined based on the unconstrained lean-and-release trials). *Significant following Holm-Bonferroni adjustment (α=0.007).

