
Figure 3.
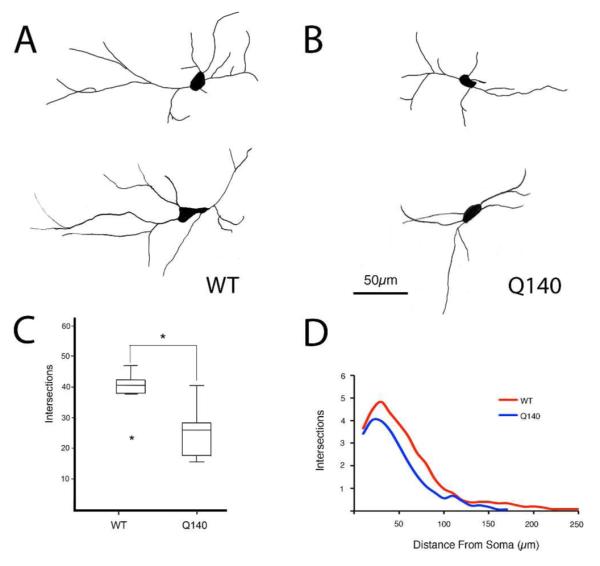
Representative camera lucida drawings of ChAT+ cholinergic interneurons at high power in the striatum of WT (A) and Q140 (B) mice, a box-and-whicker plot showing total dendrite intersections (C), and a graph showing dendrite intersections as a function of distance from the soma (D) in WT and mutant mice based on Sholl analysis. The results show that dendritic arborizations of ChAT+ interneurons were significantly decreased in Q140 heterozygous mice. One outlier is evident for the WT mice in C.