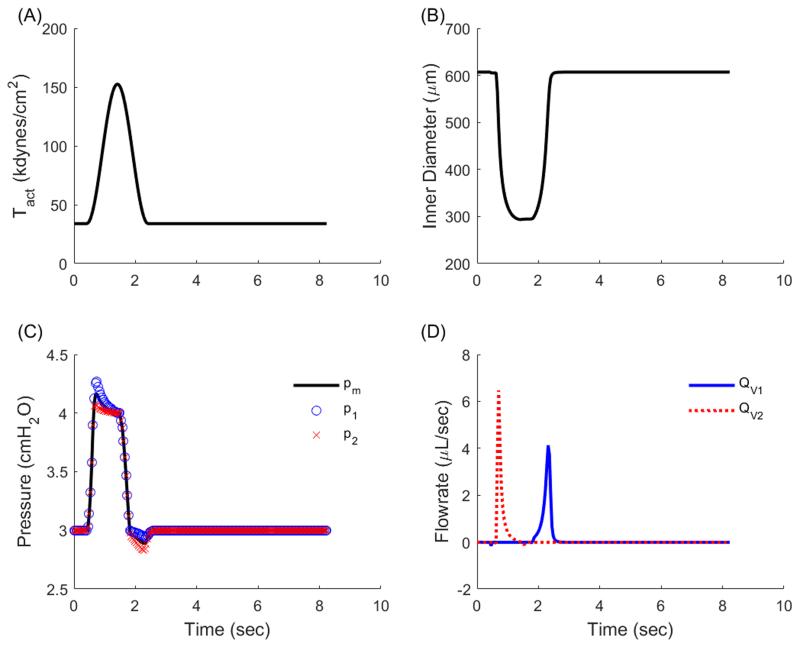
Figure 4.
Simulation results depicting time-varying geometric and mechanical waveforms for a single contractile cycle of an isolated rat thoracic duct. (A) The contractile parameter consists of a contractile and refractory period and drives geometric changes in the isolated vessel. (B) Diameter decreases during contraction to a minimum value (defined as end systolic diameter) and returns to the maximum value (end diastolic diameter). (C) Pressure increases during contraction to exceed the afterload and drive fluid expulsion and reduces below the preload during relaxation to facilitate filling. Blue ‘o’ denotes p1, black line denotes pm, and red ‘x’ denotes p2. (D) Flow experiences two distinct peaks during a contraction cycle, the first corresponding to systolic expulsion during which p2 > pb and QL = QV2, the second corresponding to diastolic filling during which p1 < pa and QL = QV1. Blue ‘o’ denotes QV1, black line denotes QL, and red ‘x’ denotes QV2.

