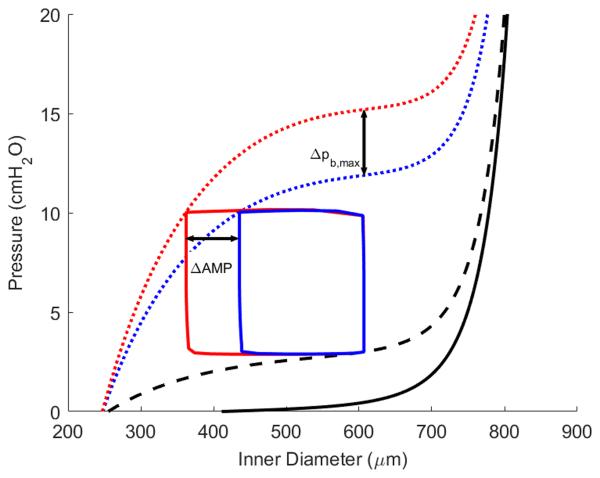
Figure 8.
Visualization of the effect of increasing systolic contractility on vessel contractile amplitude and maximum afterload. The parameter increases 37% beyond the homeostatic value. The systolic pressure-diameter curve is represented by a blue dotted line before adaptation and a red dotted line after adaptation. Corresponding pressure vs. inner diameter loops are depicted for each condition. Note that an increase in contractility also results in an increase in the maximum afterload against which the vessel can expel fluid.

