Figure 5.
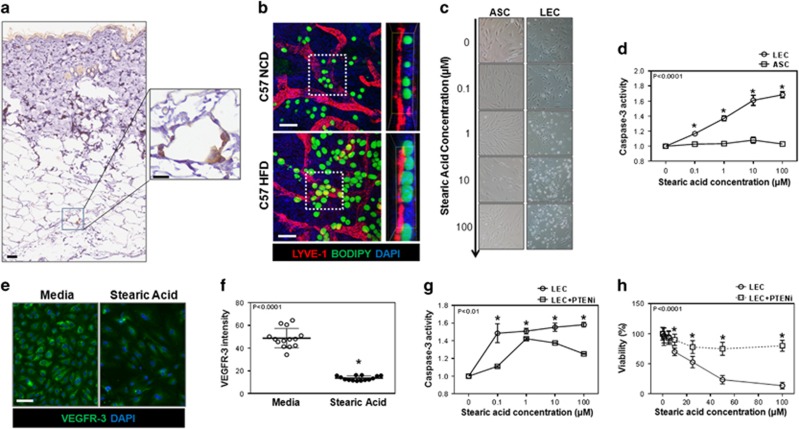
Obesity results in accumulation of large lipid droplets around lymphatic vessels. (a) Representative low (left) and high power (right) immunohistological localization of CD45+ cells (brown) surrounding adipocytes (white) in back skin of obese C57BL/6J mice (scale bars=100 and 25 μm, respectively). (b) Representative immunofluorescent localization (left) and orthoslice (right) from daughter region (white dotted square) of LYVE+ cells (red), BODIPY+ lipids (green) and nuclear DAPI stain (blue), in whole mount ear tissues of NCD- or HFD-fed C57BL/6J mice (scale bar=20 μm). (c) Representative bright-field images showing LECs (top) and ASCs (bottom) cultured in media containing increasing concentrations of SA for 12 h. (d) Quantification of caspase-3 activity in LECs (circles) and ASCs (squares) after treatment with SA for 12 h (n=3–5/group, *P<0.0001). (e) Representative immunofluorescent localization of VEGFR-3 expression (green) in LECs cultured with 10 μm of SA for 12 h (DAPI nuclear stain is shown in blue, scale bar=25 μm). (f) Quantification of VEGFR-3 expression intensity in LECs cultured in media (open circle) or media with 10 μm SA (closed circle) for 12 h (n=14/group, *P<0.0001). (g) Quantification of caspase-3 activity in LECs cultured with media containing SA (circle) or SA with 0.3 nm PTENi (square) for 12 h (n=3/group, *P<0.01). (h) Quantification of LEC viability treated with media containing SA or SA with 0.3 nm PTENi for 12 h (n=12/group, *P<0.0001).

