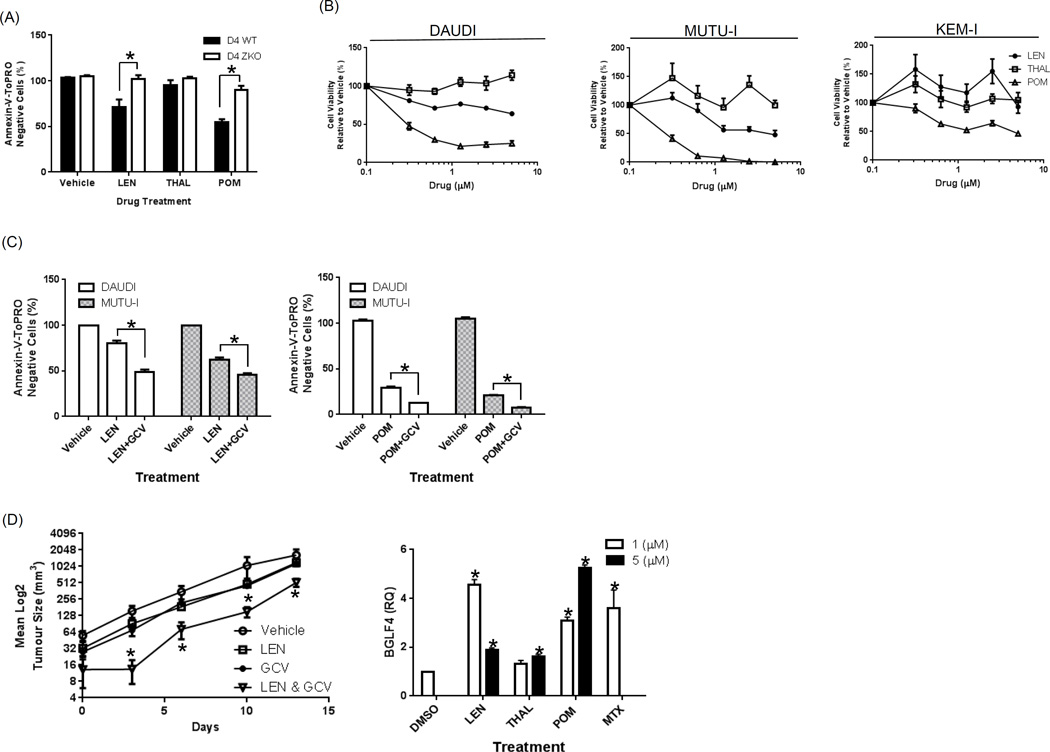
Figure 2. EBV lytic cycle enhances growth inhibition in response to LEN and POM and synergize with GCV in SCID mice.
(A) LCL cells bearing a wild-type EBV (D4 WT) or a BZLF1-deleted EBV (D4 ZKO) were treated with LTP (1 µM) or vehicle for 1 week. Flow cytometric analysis was then performed after staining with Annexin-V/TO-PRO-3 and Count Bright beads, from which the viable cell number was calculated and normalized to the vehicle control group. (B) BL cell lines were treated for 4 days with LEN, THAL, POM or vehicle, cell viability was determined using the WST-1 reagent, and results were expressed as the percentage viability relative to the vehicle control, which was arbitrarily set at 100%. (C) DAUDI and MUTU-I cells were treated for 1 week with either LEN (1 µM) or POM (0.25 µM) alone, or in combination with GCV (50 µM). Annexin-V/TO-PRO-3 and Count Bright bead flow cytometry were used to determine the viable cell numbers. Values represent the mean +/− the standard error of the mean from 3 independent experiments. An unpaired t-test was performed to evaluate for significance and “*” denotes p values of <0.01. (D) SCID mice were inoculated with MUTU-I cells subcutaneously and monitored until tumors were established. Five mice per group were injected intraperitoneally with vehicle, LEN (50 mg/kg) daily, GCV (50 mg/kg) three times per week, or the combination. Tumor volumes were measured and are plotted as a function of time for each group. Statistically significant differences comparing the combination to the single agents were determined using an unpaired t-test, and a p value of <0.02 is indicated by “*”. MUTU-I was treated with DMSO, LTP at 1 or 5 µM or 1 µM MTX as a positive control for 48 hours. RNA was harvested and cDNA synthesized and qPCR performed for BGLF-4 with RQ values normalized to the DMSO control. An unpaired t-test was performed to evaluate for significance and “*” denotes p values of <0.05 relative to the DMSO control.

