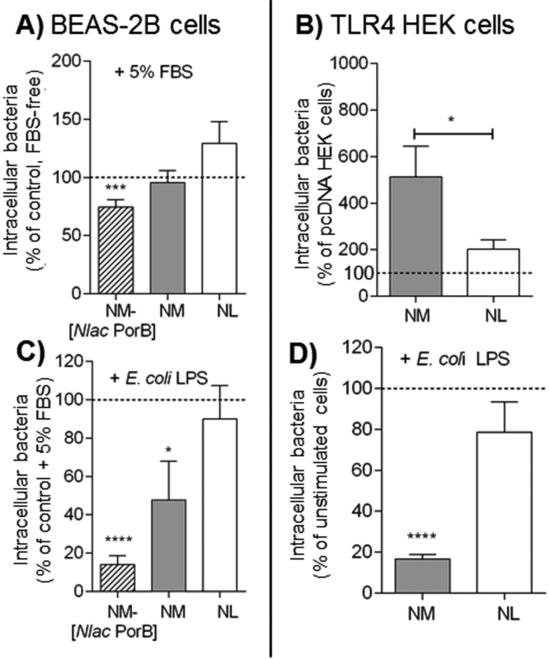
Fig 5. Intracellular Neisseriae in TLR4-permissive conditions.
A) BEAS-2B cells incubated in antibiotic-free medium supplemented with 5% FBS with NM-[Nlac PorB] (striped bars), NM (gray bars) and NL (white bars), MOI 100, 2h. Intracellular bacteria are expressed as percent relative to cells incubated with bacteria in FBS-free medium (dashed line) ± SEM. ***p = 0.0009 by one sample t test. B) Intracellular NM (gray bar) and NL (white bar), MOI 100, 2h in TLR4 HEK cells, expressed as percent relative to pcDNA HEK cells (dashed line) ± SEM. p = n.s. by one sample t test (not shown), and *p = 0.039 by Mann Whitney test. C) Intracellular bacteria NM-[Nlac PorB] (striped bar), NM (gray bar) and NL (white bar) (MOI 100, 2h) in BEAS-2B cells in medium containing 5% FBS following stimulation with E. coli LPS (200 ng/ml, 24h) is expressed as percent of non LPS-stimulated cells (dashed line) ± SEM. *p = 0.0 and ****p < 0.0001 by one sample t test. D) Intracellular NM (gray bar) and NL (white bar), MOI 100, 2h, in TLR4 HEK cells following stimulation with E. coli LPS as above. ****p < 0.0001 by one sample t test as above.

