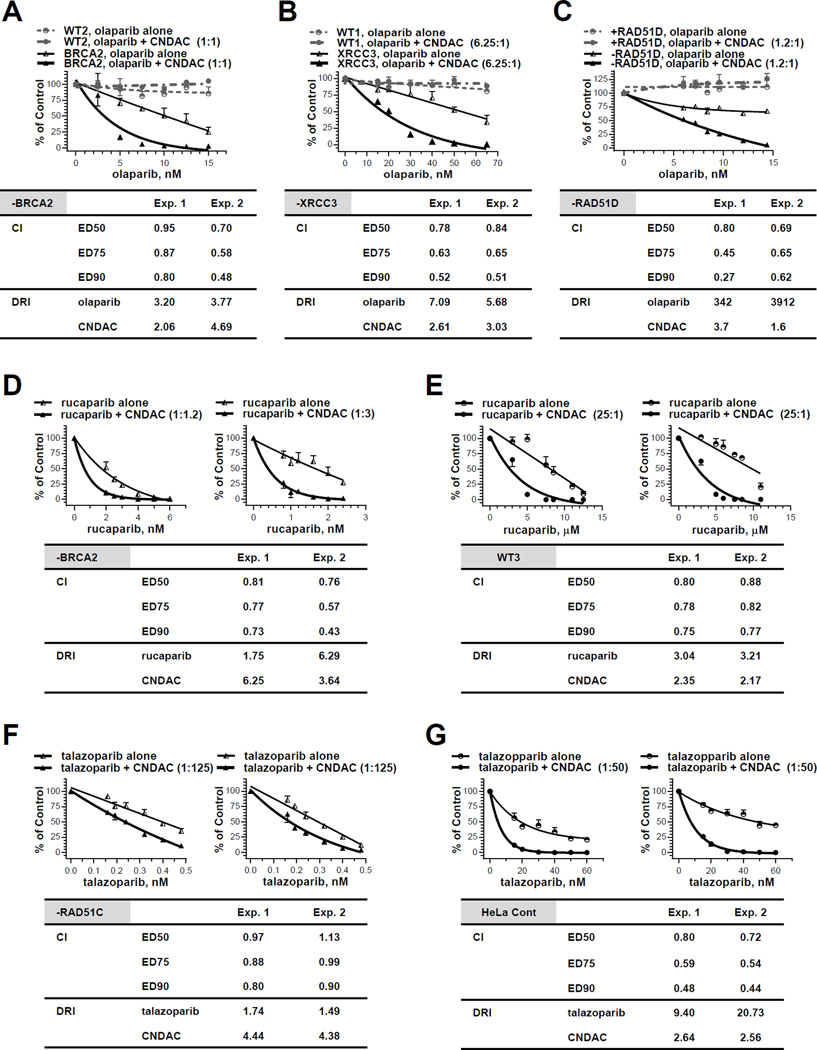
Figure 2.
The PARP1 inhibitors olaparib, rucaparib and talazoparib have synergistic effect with CNDAC. A, Chinese hamster wild-type (WT2) and BRCA2 deficient (−BRCA2) cells were exposed to olaparib (2.5 – 19.5 nM) 1 hour before addition of CNDAC (2.5 – 15 nM). After 24 hours, cells were washed out of drugs and incubated in medium with olaparib added at the same concentrations until colonies were fixed. Upper panel, representative of two independent experiments, comparison of clonogenicity of wild type and BRCA2 deficient cells after treatment with olaparib alone vs olaparib-CNDAC combination at a fixed ratio (1:1 for Exp. 1 and 1.3:1 for Exp. 2). Lower panel, CIs and DRI at 90% clonogenic inhibition from median effect analysis of the two experiments in the BRCA2 deficient line. B, CHO wild-type (WT1) and XRCC3 deficient (−XRCC3) cells were exposed to olaparib (15 – 65 nM) 1 hour before addition of CNDAC (2.4 – 10.4 nM). After 24 hours, drugs were washed out and cells were incubated in medium with olaparib at the same concentrations until colonies were fixed. Upper panel, representative of two independent experiments, comparison of clonogenicity of wild type and XRCC3 deficient cells after treatment with olaparib alone vs olaparib-CNDAC combination at a fixed ratio (6.25:1). Lower panel, CIs and DRI at 90% clonogenic inhibition from median effect analysis of the two experiments in the XRCC3 deficient line. C, RAD51D deficient (−RAD51D) and complemented (+RAD51D) CHO cells were exposed to olaparib (6 – 14.4 nM) 1 hour before addition of CNDAC (5 – 12 nM). After 24 hours, drugs were washed out and cells were incubated in medium with olaparib at the same concentrations until colonies were fixed. Upper panel, representative of two independent experiments, comparison of clonogenicity of RAD51D deficient and repleted cells after treatment with olaparib alone vs olaparib-CNDAC combination at a fixed ratio (1.2:1). Lower panel, CIs and DRI at 90% clonogenic inhibition from median effect analysis of the two experiments in the RAD51D deficient line. D - E, BRCA2 deficient (−BRCA2, D) and wild-type (WT3, E) lines were exposed to rucaparib 1 hour before addition of CNDAC. Concentrations of rucaparib tested were 0.8 – 6 nM (−BRCA2) and 3 – 12.5 µM (WT3), while concentrations of CNDAC were 2.4 – 7.2 nM (−BRCA2) and 0.12 – 0.5 µM (WT3), respectively. After 24-hour incubation, drugs were washed out and medium with rucaparib at the same concentrations were added during colony formation. Upper panels, comparison of cell clonogenicity after treatment with rucaparib alone vs rucaparib-CNDAC combination at fixed ratios (1:1.2 and 1:3 for Exp. 1 and 2, respectively, in –BRCA2 line; 25:1 for both experiments in WT3). Lower panel, CIs and DRI at 90% clonogenic inhibition from median effect analysis of the two experiments in each line. F - G, HeLa RAD51C deficient (−RAD51C, F) and control line (G) and line were exposed to talazoparib 0.5 hour before addition of CNDAC. Concentrations of talazoparib tested were 0.16 – 0.48 nM (−RAD51C) and 15 – 60 nM (HeLa Cont), while concentrations of CNDAC were 20 – 60 nM (−RAD51C) and 0.75 – 3 µM (HeLa Cont), respectively. After 24-hour incubation, drugs were washed out and medium with talazoparib at the same concentrations were added during colony formation. Upper panels, comparison of cell clonogenicity after treatment with talazoparib alone vs talazoparib-CNDAC combination at fixed ratios (1:125 for Exp. 1 and 2 in –BRCA2 line; 1:50 for both experiments in WT3). Lower panel, CIs and DRI at 90% clonogenic inhibition from median effect analysis of the two experiments in each line.

