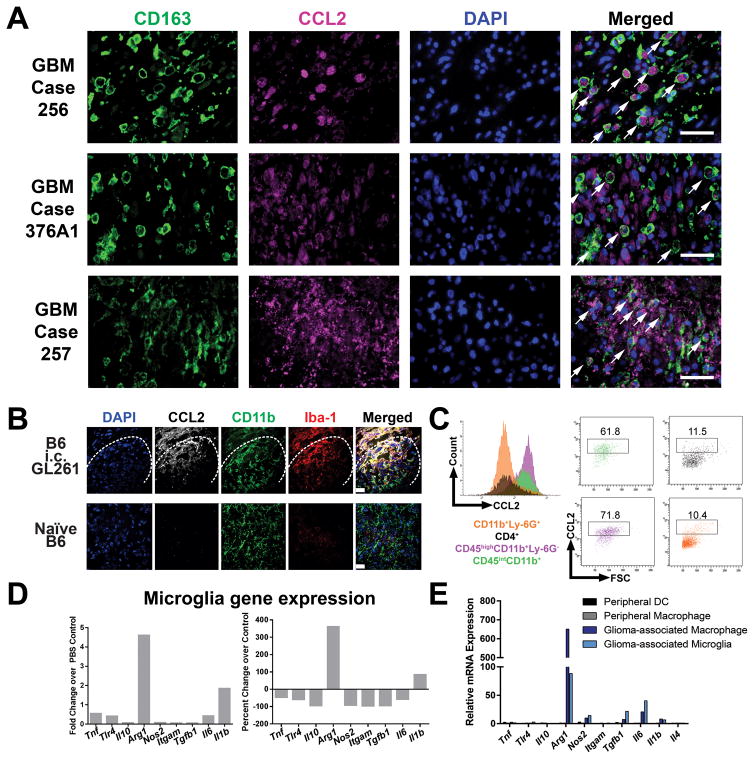
Figure 2. Myeloid cells are major sources of CCL2 in GBM patients and GL261 tumors.
(A) Double-immunofluorescence labeling of CD163 and CCL2 in GBM patient tumor samples. Scale bar = 50 μm. Arrows, CCL2-positive, CD163-positive cells. (B) Sections of 1 week post-GL261 implanted or control brains stained for CCL2, CD11b, and Iba1. Dashed line indicates tumor border. Scale bar = 10 μm. (C) Intracellular cytokine staining of CCL2 in CD45highCD11b+Ly-6G+ macrophages and CD45intCD11b+ microglia. (D) CD45intCD11b+ microglia were sorted from tumor-bearing mice (n = 5) and gene expression was analyzed by qRT-PCR compared to PBS-injected mice. (E) Expression of M1- and M2-associated genes in glioma-associated microglia and macrophages compared to peripheral macrophages and CD45highCD11b−CD11c+ dendritic cells (DCs) isolated from spleens within the same mice. Images and plots in (B–C) are representative of 3 independent replicates. Data are representative of at least 2 independent experiments. Data in A are represented as mean ± SEM; **** P < 0.0001 by Student’s t test.

