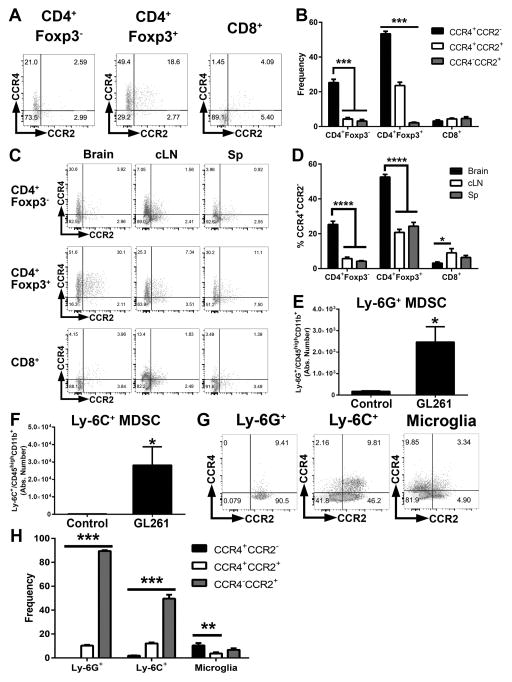
Figure 4. GL261 tumors are infiltrated by CCR4-expressing Tregs and CCR2-expressing MDSCs.
(A–B) Flow cytometric quantification of CCR4 and CCR2 expression among CD4+Foxp3− T cells, CD4+Foxp3+ Tregs, and CD8+ T cells (n = 5). (C–D) Quantification of CCR4 and CCR2 expression on T cell subsets in brain compared to cervical lymph nodes and spleen (E–F) Absolute numbers of CD11b+Ly-6G+ and CD11b+Ly-6C+ cells in the brains of tumor bearing or PBS-injected mice (n = 5). (G) CCR4 and CCR2 expression in MDSC subsets and microglia. (H) Quantification of frequencies in G (n = 5). Data are representative of at least 4 independent experiments. Data are represented as mean ± SEM; *P < 0.05, **P < 0.01, ***P < 0.001, and ****P < 0.0001 by ordinary one-way ANOVA with Tukey’s multiple comparisons test in B, D, and H or Student’s t test in E–F. cLN, cervical lymph nodes. Sp, spleen.

