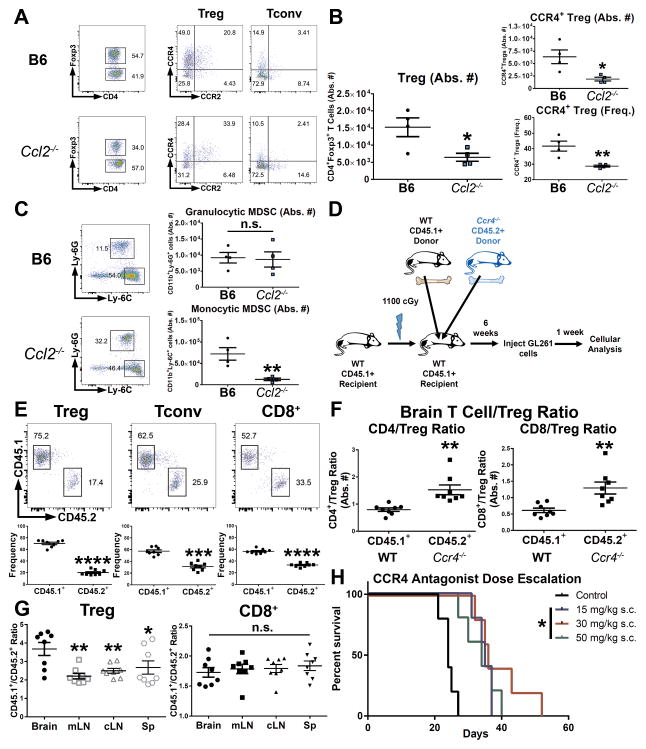
Figure 5. Mechanistic requirements of CCL2 and CCR4 for trafficking to glioma.
(A–B) Treg infiltration at 1 week post-i.c. GL261 in wild-type C57BL/6 (B6) or Ccl2−/− mice. (n = 4). (C) MDSC infiltration in brain tumors of wild-type B6 mice or Ccl2−/− mice. (D) Schematic of mixed-bone marrow chimera (BMC) experiments using wild-type CD45.1+ and CD45.2+ Ccr4−/− marrow. (E) Flow cytometric analysis of BMC experiments of WT vs. Ccr4−/− cells within the T cell compartment. (n = 8) (F) CD4/Treg ratio and CD8/Treg ratio within CCR4-deficient cells or wild-type cells in brain tumor-bearing chimeric mice (n = 8). (G) CD45.1+/CD45.2+ cell ratios in Treg or CD8+ T cell compartments across tissues in brain tumor-bearing chimeric mice (n = 8). (H) End-point analysis of mice implanted with GL261 cells and treated on alternating days with indicated doses of CCR4 antagonist (C 021) for a total of 5 doses. Data are representative of 2–3 independent experiments. Data are represented as mean ± SEM; *P < 0.05, **P < 0.01, ***P < 0.001, and ****P < 0.0001 by Student’s t test in B,C, E, F or ordinary one-way ANOVA with Tukey’s multiple comparisons test in G. Kaplan-Meier survival curves were compared with the Log-rank test with the Bonferroni method for multiple comparisons.

