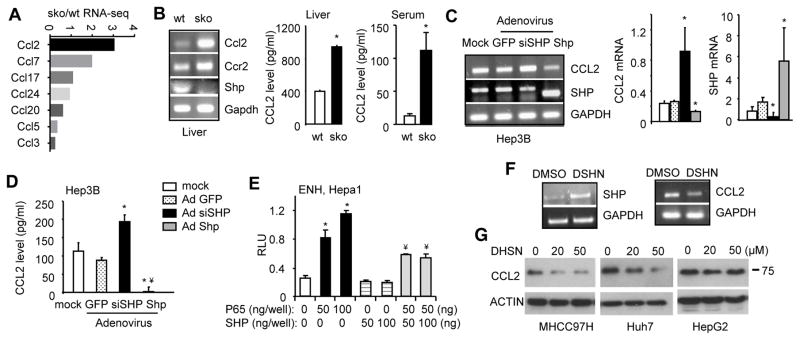
Figure 2. SHP functions as a transcriptional suppressor of Ccl2.
(A) RNA-seq of relative expression levels of Ccl family in sko vs wt liver.
(B) Left: Semi-quantitative PCR of hepatic Ccl2, Ccr2 and Shp mRNA in wildtype (wt) and Shp−/− (sko). Middle and Right: ELISA of CCL2 levels in liver and serum of wt and sko. Data is represented as mean ± SE of triplicate assays (*p<0.01 vs. white bar).
(C) Semi-quantitative PCR (left) and qPCR (middle and right) of CCL2 and SHP mRNA in Hep3B cells with Shp overexpression or knockdown (siSHP) using adenovirus (100 MOI). Lower band: mouse Shp (Ade-Shp); higher band: endogenous human SHP. Data is represented as mean ± SE of triplicate assays (*p<0.01 vs. white bar).
(D) ELISA of CCL2 protein levels in culture medium of Hep3B cells infected with indicated adenovirus (Ad, 100 MOI). Data is represented as mean ± SE of triplicate assays (*p<0.01 vs. white bar; ¥p<0.01 vs. siSHP, black bar).
(E) Promoter luciferase report assay. Hepa1 cells were cotransfected with the indicated plasmids for 48 hrs. Data is represented as mean ± SE of triplicate assays (*p<0.01 vs. white bar; ¥p<0.01 vs. 2nd bar).
(F) Semi-quantitative PCR of SHP (left) and CCL2 (right) mRNA in Huh7 cells treated with DSHN for 24 hrs (10 μm).
(G) Western blot of CCL2 protein in HCC cells treated with different doses of DSHN for 24 hr (MHCC97H, Huh7) or 48 hr (HepG2). Data are representative of two or more experiments.

