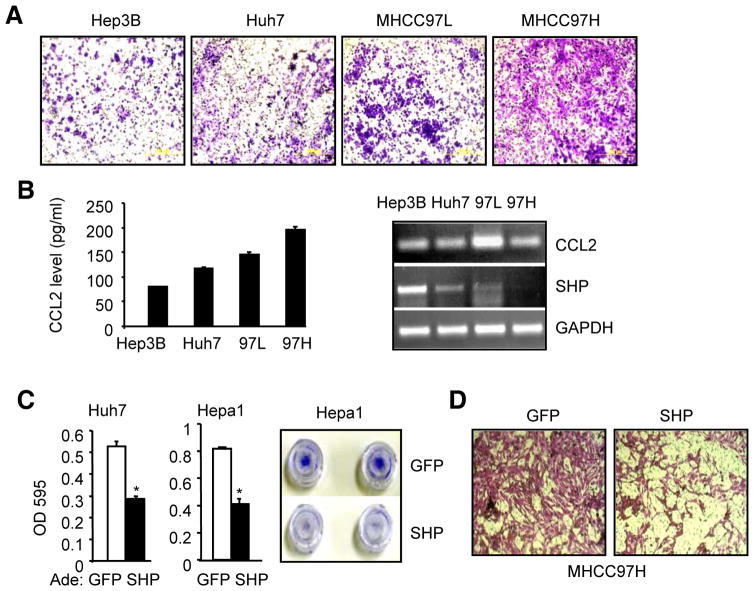
Figure 3. Overexpression of SHP inhibits HCC cell invasion and migration.
(A) Comparing the migration potential in Hep3B, Huh7, HMCC97L and MHCC97H cells. Migrated cells were visualized by the staining of crystal violet.
(B) Left: The levels of secreted CCL2 protein in culture medium as examined by ELISA. Right: Semi-quantitative PCR of CCL2 mRNA in various HCC cells.
(C) HCC cell migration assay. Huh7 (left) and Hepa1 (middle) cells were overexpressed Ade-SHP (adenovirus, 50 MOI) for 48 hrs. Data is represented as mean ± SE of triplicate assays (*p<0.01 vs. white bar). Right: Images of invaded cells stained with crystal violet.
(D) HCC cell migration assay. MHCC97H cells were transduced with Ade-SHP (50 MOI) for 48 hrs and migrated cells were visualized by the staining of crystal violet. Data are representative of two or more experiments.

