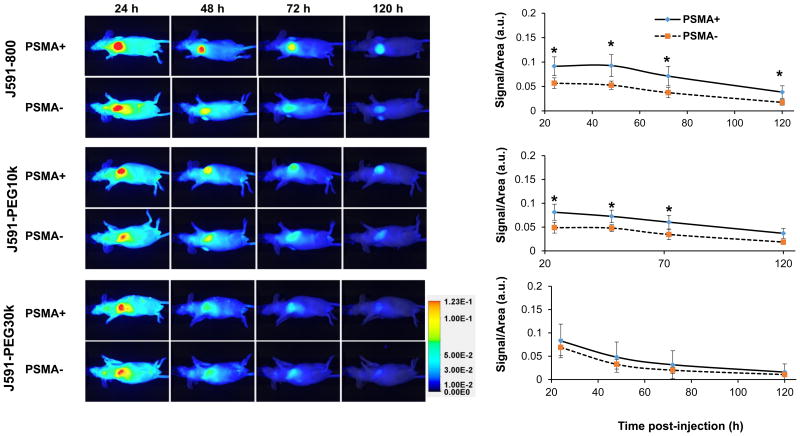
Figure 4. Near-infrared fluorescent imaging and quantification of J591-conjugate biodistribution in LMD ± PSMA xenografts.
Mice (5 animal/group) were i.v. injected with 15 μg each of J591-IR800, J591-PEG10k or J591-PEG30k and imaged after 24, 48, 72 and 120 h by LICOR PERAL optical imaging. Images of a representative animal from each group are provided. Graphs represent average signal/area (N=5) in arbitrary unit (a.u.), as described in materials and methods, over time for each tumor. Error bars represent standard deviation of the mean. Asterisk indicates statistical significance (t-test; p<0.05) between PSMA positive and negative groups at specified time points.

