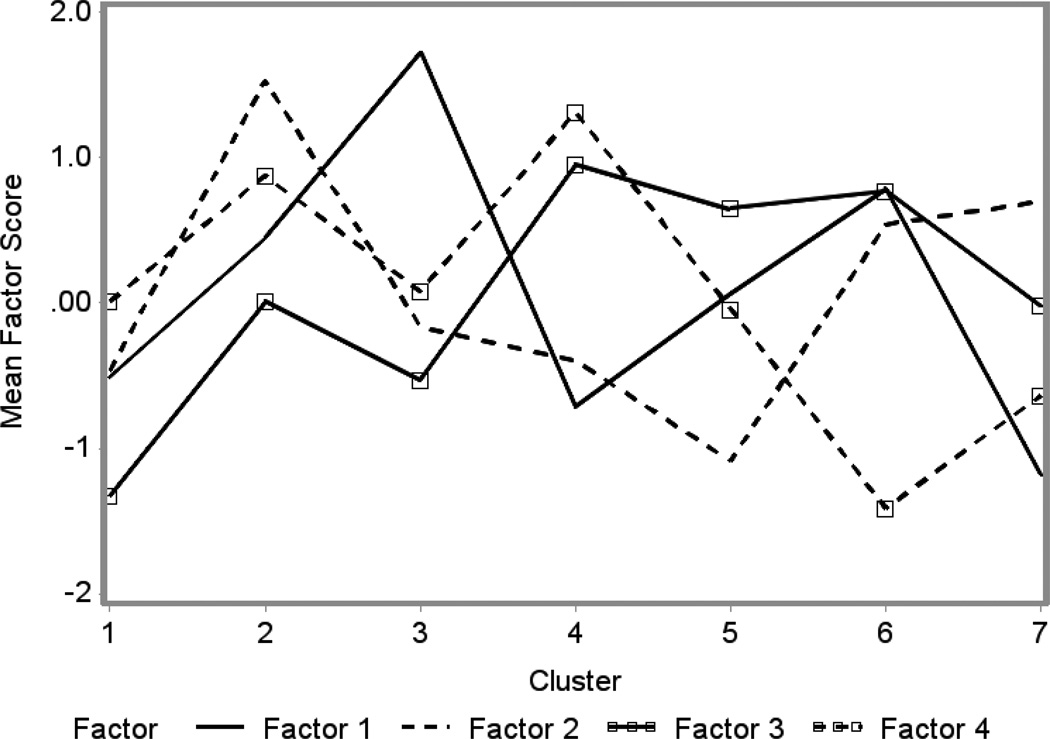
Figure 1. Patterns of SES Factor Scores Across SES Clusters.
Factor 1: Community-level greater rates of poverty, lower income, lack of higher education, greater unemployment and lower rates of immigration within the past year. Factor 2: Greater rates of language isolation, foreign-born status, crowding, education at or below the high school level, but higher rates of residential stability within the state during the past year. Factor 3: Greater rates of housing instability and country in the past year. Factor 4: Greater rates of housing stability.
Cluster 1: low economic and educational disadvantage (low poverty, higher education), immigration-related features (language isolation, foreign-born status, crowding) and residential instability; Cluster 2: high proportion of immigration-related features, residential instability, moderately high rates of economic and educational disadvantage; Cluster 3: highest proportion of economic and educational disadvantage, low rates of residential instability; Cluster 4: low rates of economic and educational disadvantage, immigration-related features, greatest rates of housing instability, immigration, but low rates of moving within the state across counties; Cluster 5: lowest levels of immigration-related factors, high rates of housing instability, moderately low economic and educational disadvantage; Cluster 6: high economic and educational disadvantage, immigration-related features, housing instability; Cluster 7: the lowest economic and educational disadvantage, high immigration-related features, moderate housing instability.

