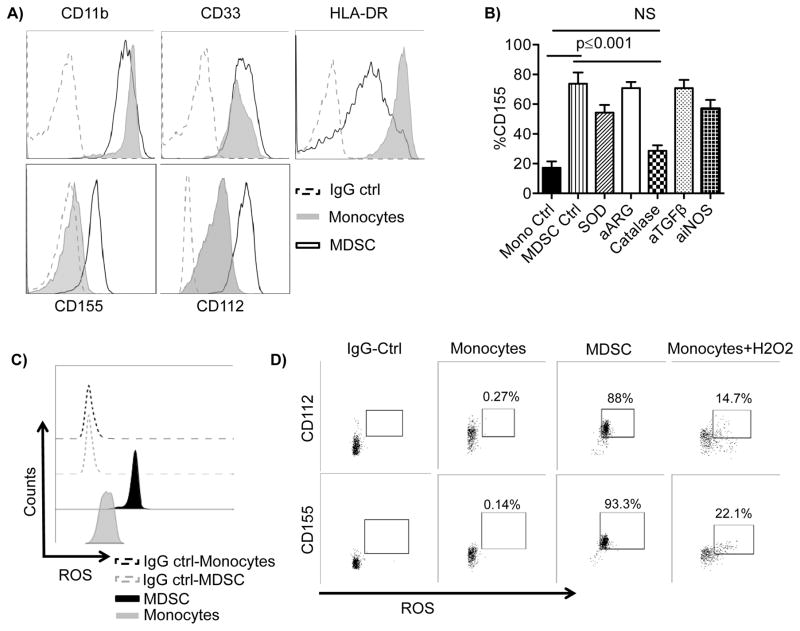
Figure 5. Reactive Oxygen Species (ROS) induce CD155 expression on MDSCs.
A) MDSCs and monocytes were stained for the antigens shown. One representative example from 10 independent experiments is shown. B) Induced MDSCs were stained for CD155 and analyzed by flow cytometry following overnight treatment with superoxide dismutase (SOD, 200 IU/mL), arginase inhibitor (a-ARG, arginase inhibitor N(ω)-hydroxy-nor-l-arginine, 500 μM), ROS scavenger (Catalase, 200 IU/mL), blocking antibodies against TGF-β (10 μg/ml), iNOS inhibitor (aiNOS, NG-monomethyl-l-arginine, 500 μM), or left untreated compared to control monocytes. Pooled (n=4) data from n independent experiments are shown as mean ± SEM, and statistical analysis were done using the Two-way ANOVA. C) Unstimulated monocytes and MDSCs were stained for total ROS and analyzed by flow cytometry. D) Unstimulated or H2O2 (250 μM) monocytes for 1 hour and unstimulated MDSCs were stained for total ROS, CD112, and CD155 and analyzed by flow cytometry. Cells double positive for ROS and CD112 or CD155 are shown. One representative donor of 6 is shown. One representative isotype control is shown for all groups for simplicity as individual controls were similar between conditions.

