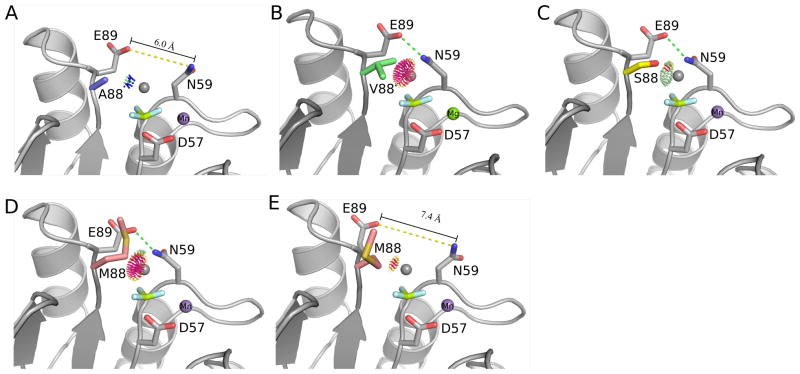
Figure 3.
Models of autodephosphorylation. A modeled water (grey sphere) was placed into the crystal structures of wild type CheY and the position T+1 mutants bound to BeF3 (light blue and yellow) to assess how various residues at this position might influence an attacking water molecule. Contacts between the modeled water and position T+1 (residue 88) were calculated using Reduce and Probe 79. Hot colored spikes (yellow, red, and hot pink) indicate van der Waals clashes, whereas lime green colored dots indicate hydrogen bonding interactions. (A) Ala at position T+1 does not interact with an attacking water. (B) β-branched residues like Val and Ile at position T+1 would sterically block an attacking water molecule. (C) The small polar residues Ser and Thr could contribute a hydrogen bonding interaction, as shown for CheYA88S. In the crystal structure of CheYA88M, the Met at position T+1 was observed in two conformations, one that would block an attacking water molecule (D) and one that minimally interacted with the modeled water molecule (E). A hydrogen bond between Asn59 and Glu89 is shown as a green dashed line when present.

