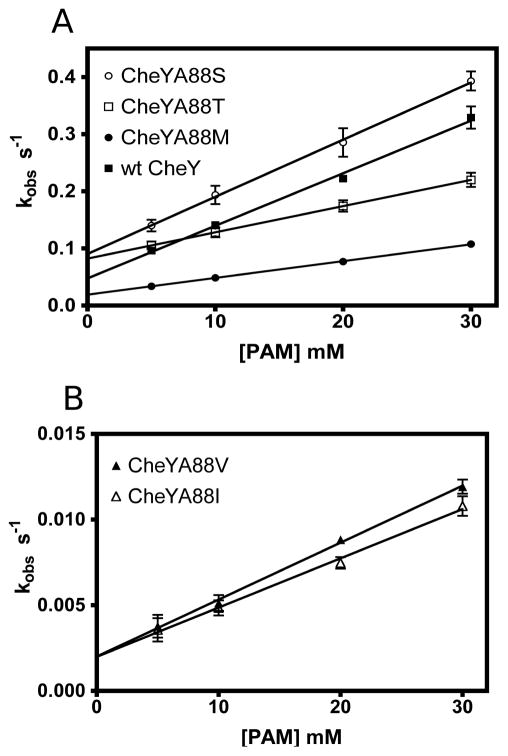
Figure 4.
Autophosphorylation kinetics of wild type CheY and position T+1 mutants using PAM as the phosphodonor. (A) Wild type CheY (closed squares), the polar mutants CheYA88S (open circles) and CheYA88T (open squares), as well as CheYA88M (closed circles). (B) β-branched mutants CheYA88V (closed triangles) and CheYA88I (open triangles). Note the difference in y-axis scales between panels A and B. Rate constants were determined by stopped-flow fluorescence at constant ionic strength. kobs is the observed rate constant for the approach to equilibrium between autophosphorylation and autodephosphorylation: kobs = (kphos/Ks)[phosphodonor] + kdephos 9, 34. Hence, the slope of the best-fit lines is the effective autophosphorylation rate constant kphos/Ks and the y-intercept is the autodephosphorylation rate constant kdephos. Note the close agreement (after conversion from units of s−1 to min−1) between kdephos values determined here and those measured by pH jump experiments (Table 2).

