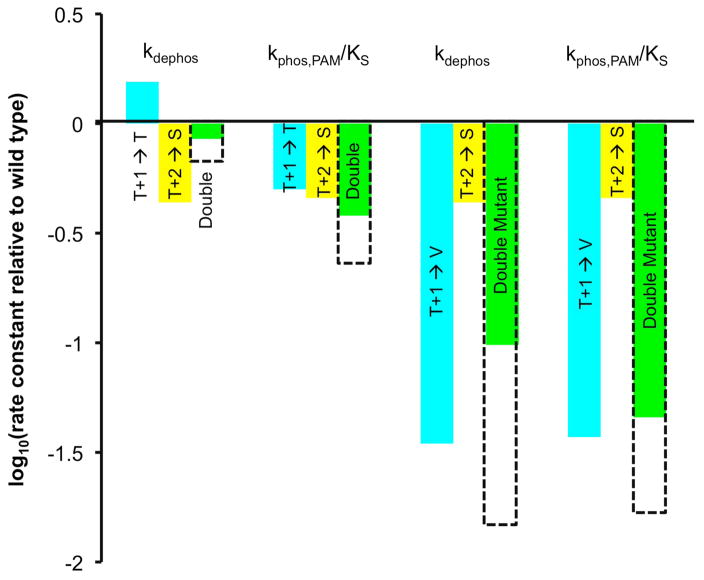
Figure 7.
Individual and combined effects of substitutions at T+1 and T+2 on CheY autodephosphorylation and autophosphorylation with PAM. Log10 of the ratios of the rate constant for each mutant to the rate constant for wild type CheY are plotted. Blue bars, mutants with indicated single substitution at T+1; yellow bars, single substitutions at T+2, green bars, substitutions at both T+1 and T+2; dashed bars, sum of values for single T+1 and T+2 substitutions (i.e. expected value of double substitution). Note that a factor of two in relative rate constants corresponds to 0.3 units on the log10 scale.

