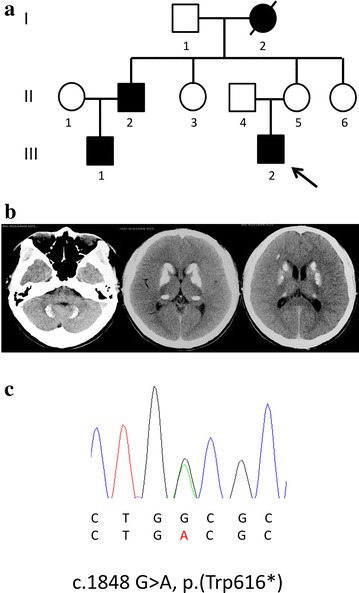
Fig. 1.

a Family tree of Case M4. The arrow indicates the index subject. Filled symbols represent family members affected by calcification. b Computed tomography images of Case M4. Typical calcification was seen in bilateral basal ganglia, dentate nuclei in the cerebellum, and the subcortical white matter. c DNA sequence electropherogram showing the mutations [c.1848 G>A, p.(Trp616*), inducing a stop codon in exon 11] in the patient (M4). Letters in red indicate mutated sequences
