FIGURE 4.

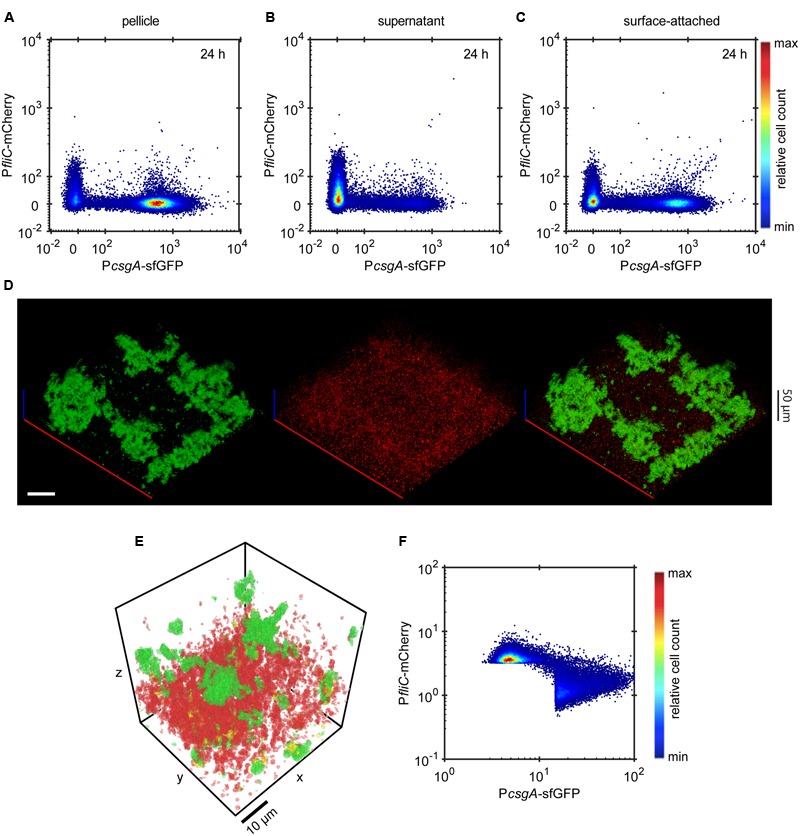
Expression of curli fibers and flagella is mutually exclusive. (A-C) Scatter plots showing expression of PcsgA-sfGFP and PfliC-mCherry in (A) pellicle, (B) supernatant and (C) surface-attached cells at 24 h as measured by flow cytometry. The color scale shows relative cell count from lowest (blue) to highest (red). (D) Confocal fluorescence microscopy images (maximum projection) showing the expression of PcsgA-sfGFP (green) and PfliC-mCherry (red) in biofilms at 24 h. Scale bar, 40 μm. (E,F) Quantification of relative expression of PcsgA-sfGFP and PfliC-mCherry (see Material and Methods for details) in a region of the submerged biofilm shown in (D), with a visual representation of the segmentation analysis (E) and relative expression in individual segments shown as a scatter plot (F). In (E) green regions are PcsgA-sfGFP-positive, red regions are PfliC-mCherry-positive and cells in yellow volumes express both fluorescence reporters. Note that sharp cutoffs in (F) correspond to the segmentation thresholds applied in image analysis (see Materials and Methods). The color scale shows relative cell count from lowest (blue) to highest (red).
