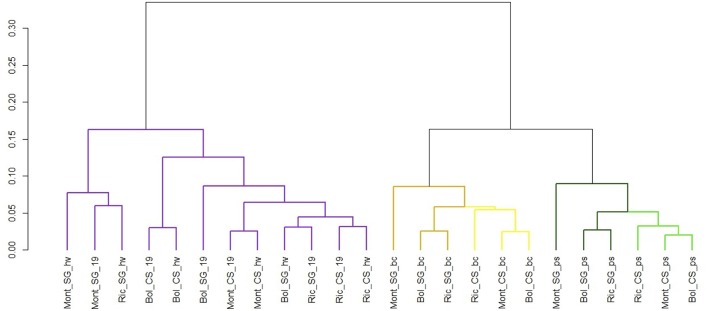
Figure 10.
Cluster dendrogram showing global relationships of miRNAs expressed in different grapevine cultivars, collected in different vineyards and developmental stages. The Pearson correlation coefficients, calculated based on the abundance of expressed miRNAs in each library, were converted into distance coefficients to define the height of the dendrogram. Different colors distinguish different clusters of samples. Library codes can be found in Table 1.

