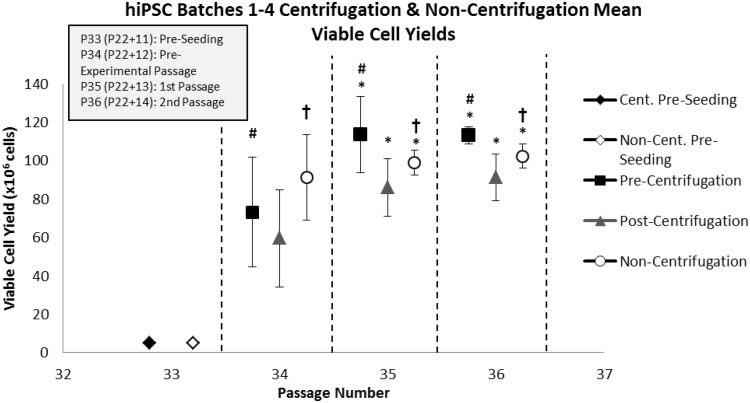
Fig. 10.
The average pre-centrifugation, post-centrifugation and non-centrifugation viable hiPSC yield per flask over the pre-experimental (P34/P22 + 12) [replicates (n) = 4], 1st (P35/P22 + 13) [replicates (n) = 4], and 2nd (P36/P22 + 14) [replicates (n) = 6] passages, and across four batches. Standard deviations are plotted as error bars. Asterisk (*) denotes significance over pre-experimental passage (p = 0.05). Number sign (#) denotes significance of pre-centrifugation hiPSCs over post-centrifugation hiPSCs over all passages (p = 0.05). Dagger symbol (†) denotes significance of non-centrifugation hiPSCs over post-centrifugation hiPSCs over all passages (p = 0.05)

