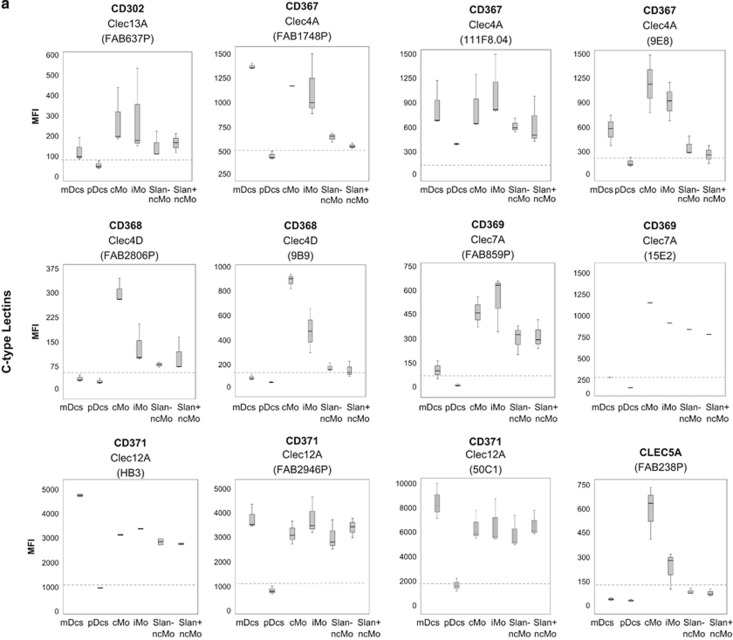
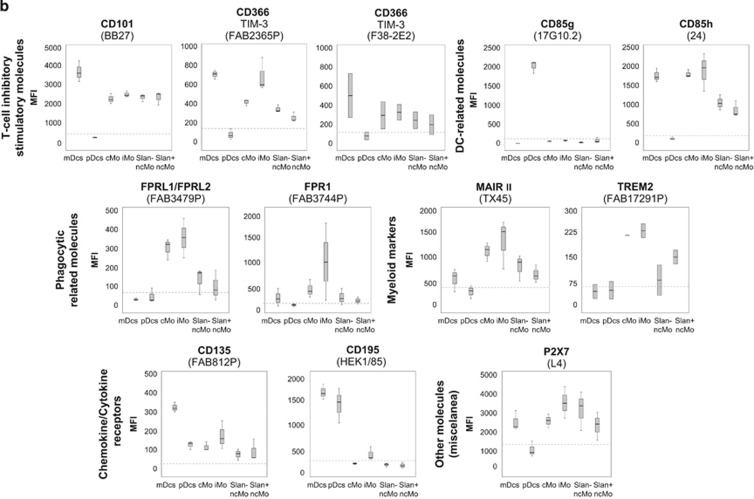
Figure 1.
Immunophenotypical characterisation of the different subsets of circulating DCs and monocytes in normal PB. Panel a shows the expression of C-type lectins, and Panel b shows the expression of T-cell inhibitory/stimulatory molecules, DC-related markers, phagocytic-related molecules, other myeloid markers, chemokine/cytokine receptors and other cell surface molecules, in the different APC subpopulations of mDCs, pDCs, cMo, iMo, SLAN− ncMo and SLAN+ ncMo present in normal adult PB in basal conditions. Within each group of molecules, only those markers found to be positive in at least one cell subset in most samples stained are represented. They are classified according to the ‘CD' code and/or their alternative name, as well as the different monoclonal antibodies used (in brackets). Results are expressed as MFI (mean fluorescence intensity) for each whole cell population (arbitrary relative mean units, scaled from 0 to 262 144). Notched boxes represent 25th and 75th percentile values; the line in the middle and vertical lines correspond to the median value and the minimum-maximum values (without the extreme values and outliers), respectively. The dotted lines correspond to the cutoff value for positivity in each plot. The graph for CD369 (clone 15E2) includes data from one single case. Data represented in graphs for CD371 (clone HB3), CD366 (clone F38–2E2) and TREM2 correspond to two cases, not to five cases, owing to an insufficient amount of the corresponding antibody available. Abbreviations: mDCs: myeloid dendritic cells; pDCs: plasmacytoid dendritic cells; cMo: classical monocytes; iMo: intermediate monocytes; ncMo: non-classical monocytes; MFI: mean fluorescence intensity (arbitrary mean units scaled from 0 to 262 144).


