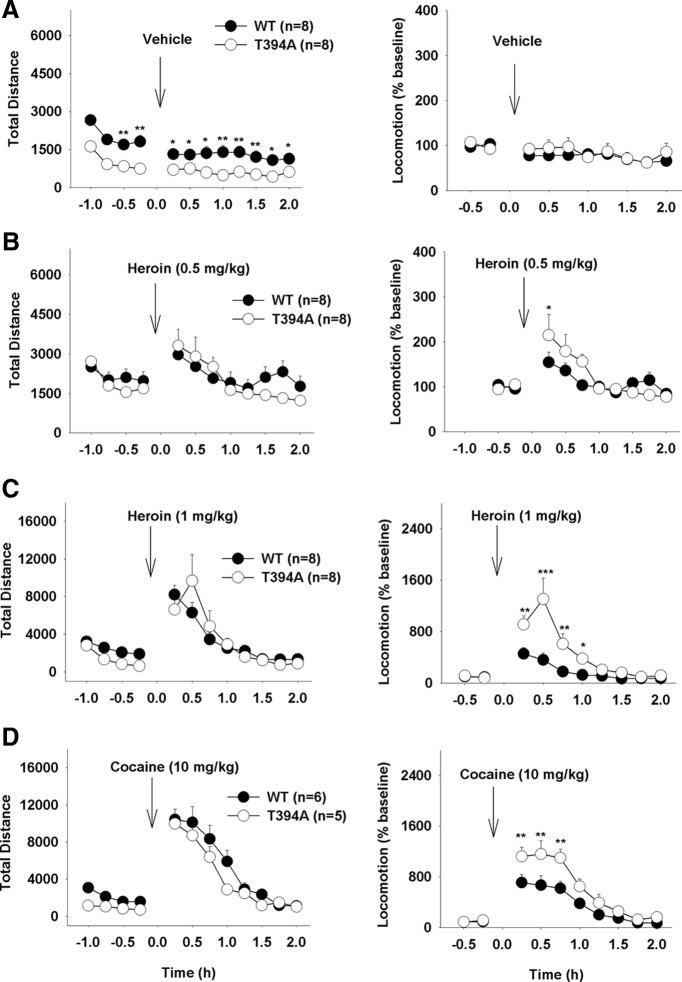
Figure 8.
Effects of T394A mutation on heroin- or cocaine-induced increase in locomotion. A–D, Left panels, Original traveled distance counts 1 h before and 2 h after different doses (0.5, 1 mg/kg, s.c) of heroin or cocaine (10 mg/kg, i.p.). Right panels, Heroin- or cocaine-induced changes in locomotion (% baseline). *p < 0.05, compared with WT mice at each time point. **p < 0.01, compared with WT mice at each time point. ***p < 0.001, compared with WT mice at each time point.

