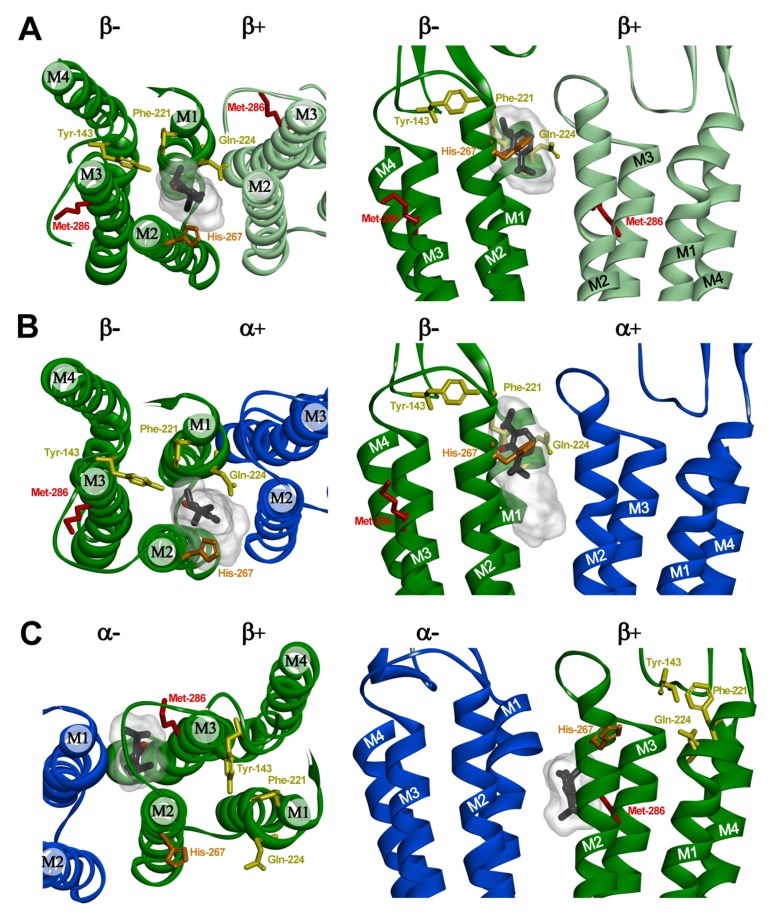
Fig. (4).
Predicted propofol binding sites at intersubunit interfaces in an α1β3 GABAA receptor homology model. The figure shows views from the top with pore at the bottom (left panels) and sideviews from the pore for β-β (A), α-β (B), and β-α (C) interfaces (right panels). Note that the interfaces are referred to with the subunit providing the “+” side of the interface named first. The α1 subunit is shown in blue and the β3 subunits are shown in green and light green. The putative propofol binding site residues that were mutated to tryptophan at the β “-” surface (Y143, F221, Q224) are colored in yellow, and the residue photolabeled with ortho-propofol diazirine (H267) in orange. The defining propofol site residue mutated at the β “+” surface (M286) is shown in red. Propofol is shown in stick format color-coded by atom type (carbon, black; oxygen red) enclosed in a transparent Connolly surface covering the 20 lowest energy docking solutions for each pocket. Propofol is shown docked in its lowest energy solution at the β-β (A) and β-α (C) interfaces. At the α-β interface (B), the propofol molecule is shown in the lowest energy solution which best agrees with the functional data. The images in the bottom panels were derived from previous docking studies [20].

